This is an excerpt from our most recent Economic Outlook report. To access the full PDF, please click here.
In this piece, I lay out three quarterly steps of analysis to undertake, to improve and update the status of any investment mind.
Undertake this discipline. Collect the latest information. Find it from formal, reputable sources.
Understand the public purpose, of its original producers.
Financial market actors do price-in this information, effectively, or ineffectively.
In turn, internal fundamental info, data that forward-looking markets rely upon, comes in at regular intervals.
Mostly, I have surmised, the ‘market view’ is based on:
- Formal U.S. Federal government data, with an earlier task, and
- Reputable private data, provided by long-established entities like Zacks
Both get updated, usually monthly or quarterly.
This piece is a rare narrative that merges both public regularly collected high-level macro data; and private intermediate data sources.
Enjoy!
The Federal Reserve Bank of St. Louis FRED system is the “go-to” place for macro data these days.
This FRED system — unbeknownst to many — offers a quick 8-chart macro snapshot into the updated workings of the current U.S. economy.
Check it every quarter, at the least. Confirm the U.S. economy’s health yourself.
Don’t just read Internet economics-related material.
Build a base of macro data knowledge and update it. Build up your concept of how the U.S. economy is doing, yourself.
This “Economy at a Glance” features key economic indicators which provide a snapshot of the U.S. economy.
The eight graphs are powered by FRED, the St. Louis Fed’s signature economic database.
I have created the eight chart hot links for you. To click through, below.
(1) Real Gross Domestic Product (the last 13 quarters, Q1-2021 to Q2-2024)
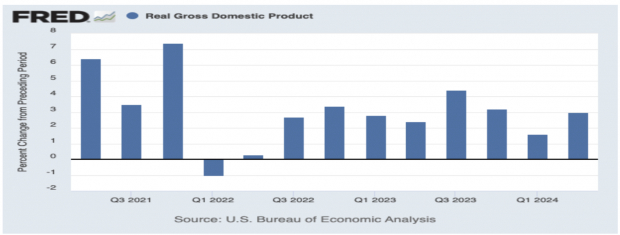
Image Source: Bureau of Economic Analysis
Confirm: There is stable underlying U.S. aggregate demand growth, quarter after quarter, for eight quarters in a row now (2 full years to Q2-2024).
Check the latest Atlanta Fed GDPNow for a fresher quarterly update. It currently shows +2.5% for Q3-2024.
(2) Real Personal Consumption Expenditures
(3) Consumer Price Index and Personal Consumption Expenditures Price Index
(4) Nonfarm Payroll Employment
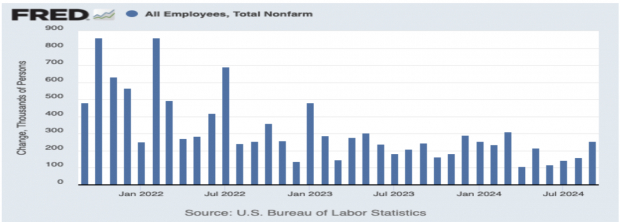
Image Source: St Louis Federal Reserve
Confirm: U.S. employers are adding jobs month-after-month.
Firms fire workers when there is demand stress on their businesses. This is termed a ‘co-incidental’ macro indictor. Since it comes out monthly, and not quarterly, it is fresher too.
(5) Unemployment Rate
(6) Housing Starts
(7) 10-Year U.S. Treasury Rate
(8) St. Louis Fed Financial Stress Index
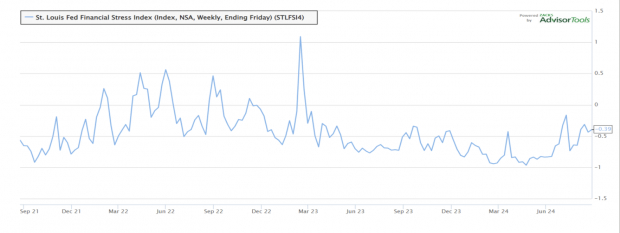
Image Source: St Louis Federal Reserve
Confirm: After the Financial Stress spiked in April 2023, due to the Regional Banking crisis, the underlying Fed Financial Stress Index improved, notably!
This was due to multiple liquidity interventions by the Federal Reserve system and the U.S. Treasury.
Lesson: Don’t just pay attention to the level of the Federal Funds rate anymore. After 2008, the Fed and Treasury have intervened in multiple ways, when prompted.


Image: Bigstock
Quarterly Steps to a Better Investing Life
This is an excerpt from our most recent Economic Outlook report. To access the full PDF, please click here.
In this piece, I lay out three quarterly steps of analysis to undertake, to improve and update the status of any investment mind.
Undertake this discipline. Collect the latest information. Find it from formal, reputable sources.
Understand the public purpose, of its original producers.
Financial market actors do price-in this information, effectively, or ineffectively.
In turn, internal fundamental info, data that forward-looking markets rely upon, comes in at regular intervals.
Mostly, I have surmised, the ‘market view’ is based on:
Both get updated, usually monthly or quarterly.
This piece is a rare narrative that merges both public regularly collected high-level macro data; and private intermediate data sources.
Enjoy!
The Federal Reserve Bank of St. Louis FRED system is the “go-to” place for macro data these days.
This FRED system — unbeknownst to many — offers a quick 8-chart macro snapshot into the updated workings of the current U.S. economy.
Check it every quarter, at the least. Confirm the U.S. economy’s health yourself.
Don’t just read Internet economics-related material.
Build a base of macro data knowledge and update it. Build up your concept of how the U.S. economy is doing, yourself.
This “Economy at a Glance” features key economic indicators which provide a snapshot of the U.S. economy.
The eight graphs are powered by FRED, the St. Louis Fed’s signature economic database.
I have created the eight chart hot links for you. To click through, below.
(1) Real Gross Domestic Product (the last 13 quarters, Q1-2021 to Q2-2024)
Image Source: Bureau of Economic Analysis
Confirm: There is stable underlying U.S. aggregate demand growth, quarter after quarter, for eight quarters in a row now (2 full years to Q2-2024).
Check the latest Atlanta Fed GDPNow for a fresher quarterly update. It currently shows +2.5% for Q3-2024.
(2) Real Personal Consumption Expenditures
(3) Consumer Price Index and Personal Consumption Expenditures Price Index
(4) Nonfarm Payroll Employment
Image Source: St Louis Federal Reserve
Confirm: U.S. employers are adding jobs month-after-month.
Firms fire workers when there is demand stress on their businesses. This is termed a ‘co-incidental’ macro indictor. Since it comes out monthly, and not quarterly, it is fresher too.
(5) Unemployment Rate
(6) Housing Starts
(7) 10-Year U.S. Treasury Rate
(8) St. Louis Fed Financial Stress Index
Image Source: St Louis Federal Reserve
Confirm: After the Financial Stress spiked in April 2023, due to the Regional Banking crisis, the underlying Fed Financial Stress Index improved, notably!
This was due to multiple liquidity interventions by the Federal Reserve system and the U.S. Treasury.
Lesson: Don’t just pay attention to the level of the Federal Funds rate anymore. After 2008, the Fed and Treasury have intervened in multiple ways, when prompted.