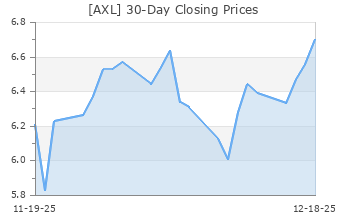
American Axle & Manufacturing Holdings (AXL)
(Delayed Data from NYSE)
$6.77 USD
+0.55 (8.84%)
Updated Nov 8, 2024 04:00 PM ET
After-Market: $6.78 +0.01 (0.15%) 6:16 PM ET
2-Buy of 5 2
A Value A Growth D Momentum A VGM
Company Summary
Detroit-based American Axle & Manufacturing Holdings, Inc. is a leading supplier of driveline and drivetrain systems, modules and components for the light vehicle market. It manufactures Driveline and Metal Forming technologies to support electric, hybrid and internal combustion vehicles. The company operates with around 80 facilities in 18 countries. American Axle’s major customers include General Motors, Stellantis and Ford.
American Axle is the primary supplier of driveline components to General Motors for its full-size RWD light trucks, SUV, and crossover vehicles manufactured in North America. American Axle also supplies GM with various ...
Company Summary
Detroit-based American Axle & Manufacturing Holdings, Inc. is a leading supplier of driveline and drivetrain systems, modules and components for the light vehicle market. It manufactures Driveline and Metal Forming technologies to support electric, hybrid and internal combustion vehicles. The company operates with around 80 facilities in 18 countries. American Axle’s major customers include General Motors, Stellantis and Ford.
American Axle is the primary supplier of driveline components to General Motors for its full-size RWD light trucks, SUV, and crossover vehicles manufactured in North America. American Axle also supplies GM with various products from its Metal Forming segment. Sales to GM constituted almost 39% of American Axle’s consolidated net sales in 2023.
American Axle supplies driveline system products to Stellantis for programs including the heavy-duty Ram full-size pickup trucks and its derivatives, the AWD Chrysler Pacifica and the AWD Jeep Cherokee. Additionally, it also sells various products to Stellantis from Metal Forming segment. In 2023, sales to Stellantis accounted for 16% of American Axle’s consolidated net sales.
American Axle is a key supplier of driveline system products to Ford on certain vehicle programs including the Ford Bronco Sport, Ford Edge, Ford Escape and Lincoln Nautilus. The company also sells various products to Ford from Metal Forming segment. Sales to Ford comprised of 12% of its consolidated net sales in 2023.
American Axle has the following two operating segments:
Driveline (68.7% of consolidated net sales in 2023) products consist primarily of front and rear axles, driveshafts, differential assemblies, clutch modules, balance shaft systems, disconnecting driveline technology, and electric and hybrid driveline products and systems for light trucks, SUVs, crossover vehicles, passenger cars and commercial vehicles.
Metal Forming (40.3%) products consist primarily of axle and transmission shafts, ring and pinion gears, differential gears and assemblies, connecting rods and variable valve timing products for OEM and Tier 1 automotive suppliers.
General Information
American Axle & Manufacturing Holdings, Inc
ONE DAUCH DRIVE
DETROIT, MI 48211
Phone: 313-758-2000
Fax: 313-974-3090
Web: http://www.aam.com
Email: investorrelations@aam.com
| Industry | Automotive - Original Equipment |
| Sector | Auto-Tires-Trucks |
| Fiscal Year End | December |
| Last Reported Quarter | 9/30/2024 |
| Exp Earnings Date | 11/8/2024 |
EPS Information
| Current Quarter EPS Consensus Estimate | 0.01 |
| Current Year EPS Consensus Estimate | 0.35 |
| Estimated Long-Term EPS Growth Rate | NA |
| Exp Earnings Date | 11/8/2024 |
Price and Volume Information
| Zacks Rank | |
| Yesterday's Close | 6.22 |
| 52 Week High | 9.00 |
| 52 Week Low | 5.43 |
| Beta | 1.95 |
| 20 Day Moving Average | 1,627,152.75 |
| Target Price Consensus | 7.75 |

| 4 Week | 3.49 |
| 12 Week | -1.74 |
| YTD | -29.40 |
| 4 Week | 0.15 |
| 12 Week | -8.81 |
| YTD | -43.62 |
| Shares Outstanding (millions) | 117.58 |
| Market Capitalization (millions) | 731.35 |
| Short Ratio | NA |
| Last Split Date | NA |
| Dividend Yield | 0.00% |
| Annual Dividend | $0.00 |
| Payout Ratio | 0.00 |
| Change in Payout Ratio | 0.00 |
| Last Dividend Payout / Amount | NA / $0.00 |
Fundamental Ratios
| P/E (F1) | 17.74 |
| Trailing 12 Months | 36.59 |
| PEG Ratio | NA |
| vs. Previous Year (Q0/Q-4) | 58.33% |
| vs. Previous Quarter (Q0/Q-1) | 5.56% |
| vs. Previous Year (Q0/Q-4) | 3.92% |
| vs. Previous Quarter (Q0/Q-1) | 1.58% |
| Price/Book | 1.20 |
| Price/Cash Flow | 1.53 |
| Price / Sales | 0.12 |
| 9/30/24 | Pending Next EPS Report |
| 6/30/24 | 3.47 |
| 3/31/24 | 1.92 |
| 9/30/24 | Pending Next EPS Report |
| 6/30/24 | 0.39 |
| 3/31/24 | 0.22 |
| 9/30/24 | Pending Next EPS Report |
| 6/30/24 | 1.68 |
| 3/31/24 | 1.69 |
| 9/30/24 | Pending Next EPS Report |
| 6/30/24 | 1.30 |
| 3/31/24 | 1.31 |
| 9/30/24 | Pending Next EPS Report |
| 6/30/24 | 0.34 |
| 3/31/24 | 0.19 |
| 9/30/24 | Pending Next EPS Report |
| 6/30/24 | 0.04 |
| 3/31/24 | -0.13 |
| 9/30/24 | Pending Next EPS Report |
| 6/30/24 | 0.63 |
| 3/31/24 | 0.27 |
| 9/30/24 | Pending Next EPS Report |
| 6/30/24 | 5.19 |
| 3/31/24 | 5.29 |
| 9/30/24 | Pending Next EPS Report |
| 6/30/24 | 11.76 |
| 3/31/24 | 11.66 |
| 9/30/24 | Pending Next EPS Report |
| 6/30/24 | 4.42 |
| 3/31/24 | 4.40 |
| 9/30/24 | Pending Next EPS Report |
| 6/30/24 | 81.55 |
| 3/31/24 | 81.49 |

