CBRE Group (CBRE)
(Delayed Data from NYSE)
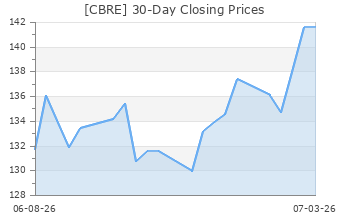
$123.75 USD
-0.73 (-0.59%)
Updated Oct 1, 2024 04:00 PM ET
After-Market: $123.72 -0.03 (-0.02%) 7:58 PM ET
2-Buy of 5 2
C Value C Growth D Momentum C VGM
Company Summary
Headquartered in Dallas, TX, CBRE Group, Inc. is a commercial real estate services and investment firm, offering a wide range of services to tenants, owners, lenders and investors in office, retail, industrial, multi-family and other types of commercial real estates in all major metropolitan areas across the globe. The services include facilities, transaction and project management; property management; investment management; appraisal and valuation; property leasing; strategic consulting; property sales; mortgage services and development services. With more than 130,000 employees (including Turner & Townsend employees), the company served clients in more than 100 countries as of June 30, 2024.
...
Company Summary
Headquartered in Dallas, TX, CBRE Group, Inc. is a commercial real estate services and investment firm, offering a wide range of services to tenants, owners, lenders and investors in office, retail, industrial, multi-family and other types of commercial real estates in all major metropolitan areas across the globe. The services include facilities, transaction and project management; property management; investment management; appraisal and valuation; property leasing; strategic consulting; property sales; mortgage services and development services. With more than 130,000 employees (including Turner & Townsend employees), the company served clients in more than 100 countries as of June 30, 2024.
CBRE Group reports on three global business segments: Advisory Services, Global Workplace Solutions and Real Estate Investments. However, effective Jan 1, 2021, the company’s organizational structure has been realigned.
Advisory Services offers a broad range of services globally. This includes property leasing, property sales, mortgage services, property management, and valuation.
Global Workplace Solutions (GWS) offers an extensive suite of integrated, contractually-based outsourcing services to occupiers of real estate, including facilities management and project management. In June 2024, CBRE Group announced its plan to combine its Project Management business with Turner & Townsend. Subject to satisfaction of regulatory and other customary conditions, as well as completion of required consultations with employee Works Councils in certain jurisdictions, the transaction is expected to close at the end of 2024. Starting from 2025, CBRE Group plans to present Project Management results in a new segment. This new segment will be separate from Global Workplace Solutions and will aim to enhance transparency for investors.
Real Estate Investments include investment management services provided globally and development services in the United States, the United Kingdom and Continental Europe.
At the end of the second quarter of 2024, assets under management decreased by $1.5 billion from the first quarter of 2024 to $142.5 billion.
General Information
CBRE Group, Inc
2121 North Pearl Street Suite 300
DALLAS, TX 75201
Phone: 214-979-6100
Fax: 213-613-3005
Web: http://www.cbre.com
Email: chandni.luthra@cbre.com
| Industry | Real Estate - Operations |
| Sector | Finance |
| Fiscal Year End | December |
| Last Reported Quarter | 9/30/2024 |
| Earnings Date | 10/24/2024 |
EPS Information
| Current Quarter EPS Consensus Estimate | 1.06 |
| Current Year EPS Consensus Estimate | 4.75 |
| Estimated Long-Term EPS Growth Rate | NA |
| Earnings Date | 10/24/2024 |
Price and Volume Information
| Zacks Rank | |
| Yesterday's Close | 124.48 |
| 52 Week High | 124.84 |
| 52 Week Low | 64.63 |
| Beta | 1.40 |
| 20 Day Moving Average | 1,658,605.12 |
| Target Price Consensus | 117.67 |
| 4 Week | 8.11 |
| 12 Week | 40.88 |
| YTD | 33.72 |
| 4 Week | 5.97 |
| 12 Week | 36.24 |
| YTD | 10.69 |
| Shares Outstanding (millions) | 306.43 |
| Market Capitalization (millions) | 38,144.59 |
| Short Ratio | NA |
| Last Split Date | 6/2/2006 |
| Dividend Yield | 0.00% |
| Annual Dividend | $0.00 |
| Payout Ratio | 0.00 |
| Change in Payout Ratio | 0.00 |
| Last Dividend Payout / Amount | NA / $0.00 |
Fundamental Ratios
| P/E (F1) | 26.20 |
| Trailing 12 Months | 33.73 |
| PEG Ratio | NA |
| vs. Previous Year | -1.22% |
| vs. Previous Quarter | 3.85% |
| vs. Previous Year | 8.69% |
| vs. Previous Quarter | 5.75% |
| Price/Book | 4.15 |
| Price/Cash Flow | 20.77 |
| Price / Sales | 1.15 |
| 6/30/24 | 12.74 |
| 3/31/24 | 12.96 |
| 12/31/23 | 13.69 |
| 6/30/24 | 5.03 |
| 3/31/24 | 5.18 |
| 12/31/23 | 5.52 |
| 6/30/24 | 1.12 |
| 3/31/24 | 1.15 |
| 12/31/23 | 1.17 |
| 6/30/24 | 1.12 |
| 3/31/24 | 1.15 |
| 12/31/23 | 1.17 |
| 6/30/24 | 3.44 |
| 3/31/24 | 3.54 |
| 12/31/23 | 3.75 |
| 6/30/24 | 2.79 |
| 3/31/24 | 3.06 |
| 12/31/23 | 3.09 |
| 6/30/24 | 3.49 |
| 3/31/24 | 3.83 |
| 12/31/23 | 4.00 |
| 6/30/24 | 29.99 |
| 3/31/24 | 29.64 |
| 12/31/23 | 29.75 |
| 6/30/24 | NA |
| 3/31/24 | NA |
| 12/31/23 | NA |
| 6/30/24 | 0.36 |
| 3/31/24 | 0.36 |
| 12/31/23 | 0.31 |
| 6/30/24 | 26.26 |
| 3/31/24 | 26.51 |
| 12/31/23 | 23.62 |