Diamondback Energy (FANG)
(Delayed Data from NSDQ)
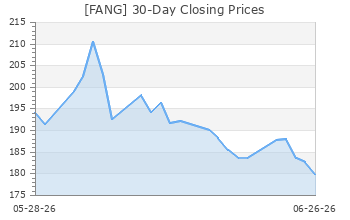
$193.77 USD
-5.73 (-2.87%)
Updated Oct 8, 2024 04:00 PM ET
After-Market: $192.91 -0.86 (-0.44%) 7:26 PM ET
3-Hold of 5 3
C Value C Growth F Momentum D VGM
Company Summary
Founded in 2007, Midland, TX-headquartered Diamondback Energy, Inc. is an independent oil and gas exploration & production company with its primary focus on the Permian Basin, where it has more than 490,000 net acres. Its activities are concentrated in the Wolfcamp, Spraberry and Bone Spring formations.
Diamondback focuses on growth through a combination of acquisitions and active drilling in America's hottest and lowest-cost shale region. The upstream operator has a long history of acquisitions that include the 2018 buyouts of Energen Corporation and Ajax Resources, culminating in the 2021 purchase of shale explorer QEP ...
Company Summary
Founded in 2007, Midland, TX-headquartered Diamondback Energy, Inc. is an independent oil and gas exploration & production company with its primary focus on the Permian Basin, where it has more than 490,000 net acres. Its activities are concentrated in the Wolfcamp, Spraberry and Bone Spring formations.
Diamondback focuses on growth through a combination of acquisitions and active drilling in America's hottest and lowest-cost shale region. The upstream operator has a long history of acquisitions that include the 2018 buyouts of Energen Corporation and Ajax Resources, culminating in the 2021 purchase of shale explorer QEP Resources and privately held Midland-driller Guidon Energy.
At the end of 2023, Diamondback held around 2,178 million barrels of oil equivalent in proved reserves (53% oil, 60% proved developed). Diamondback’s average daily output totaled 448 thousand barrels of oil equivalent per day in 2023, of which some 58% was oil.
Diamondback also has other oil and gas-related operations through Viper Energy Partners L.P. (54%-owned publicly traded royalty business) and Rattler Midstream Partners L.P. (100%-owned midstream business)..
The Permian ‘Super’ Basin
A sedimentary basin lying underneath the western part of Texas and the south-eastern part of New Mexico, the Permian Basin Shale covers roughly 75,000 square miles, almost half the size of California. Experts say that it’s cheaper to drill and complete oil wells in the Permian Basin as compared to most other major fields. Moreover, there are certain parts of the shale play whose well-returns are the best in the United States.
According to business information provider IHS Markit, the Permian play is estimated to hold a staggering 60-70 billion barrels of recoverable oil. Oil production in this unconventional play, meanwhile, continues to set records and currently churns out more than 5 million barrels a day, according to data from the Department of Energy. In fact, output from the Permian Basin currently makes up about a third of the total U.S. oil production. It is primarily because of the Permian shale that the United States has turned into the world's biggest oil producer.
General Information
Diamondback Energy, Inc
500 West Texas Ave. Suite 100
Midland, TX 79701
Phone: 432-221-7400
Fax: NA
Web: http://www.diamondbackenergy.com
Email: ir@diamondbackenergy.com
| Industry | Oil and Gas - Exploration and Production - United States |
| Sector | Oils-Energy |
| Fiscal Year End | December |
| Last Reported Quarter | 9/30/2024 |
| Earnings Date | 11/4/2024 |
EPS Information
| Current Quarter EPS Consensus Estimate | 4.59 |
| Current Year EPS Consensus Estimate | 19.18 |
| Estimated Long-Term EPS Growth Rate | 8.30 |
| Earnings Date | 11/4/2024 |
Price and Volume Information
| Zacks Rank | |
| Yesterday's Close | 199.50 |
| 52 Week High | 214.50 |
| 52 Week Low | 145.70 |
| Beta | 1.89 |
| 20 Day Moving Average | 3,048,188.00 |
| Target Price Consensus | 221.12 |
| 4 Week | 11.32 |
| 12 Week | -5.42 |
| YTD | 28.64 |
| 4 Week | 6.93 |
| 12 Week | -6.49 |
| YTD | 7.73 |
| Shares Outstanding (millions) | 294.74 |
| Market Capitalization (millions) | 58,801.13 |
| Short Ratio | NA |
| Last Split Date | NA |
| Dividend Yield | 1.80% |
| Annual Dividend | $3.60 |
| Payout Ratio | 0.19 |
| Change in Payout Ratio | -0.03 |
| Last Dividend Payout / Amount | 8/15/2024 / $2.34 |
Fundamental Ratios
| P/E (F1) | 10.40 |
| Trailing 12 Months | 10.36 |
| PEG Ratio | 1.25 |
| vs. Previous Year | 22.83% |
| vs. Previous Quarter | 0.44% |
| vs. Previous Year | 29.39% |
| vs. Previous Quarter | 11.50% |
| Price/Book | 1.92 |
| Price/Cash Flow | 7.13 |
| Price / Sales | 6.34 |
| 9/30/24 | Pending Next EPS Report |
| 6/30/24 | 19.54 |
| 3/31/24 | 19.36 |
| 9/30/24 | Pending Next EPS Report |
| 6/30/24 | 11.33 |
| 3/31/24 | 11.62 |
| 9/30/24 | Pending Next EPS Report |
| 6/30/24 | 3.66 |
| 3/31/24 | 0.92 |
| 9/30/24 | Pending Next EPS Report |
| 6/30/24 | 3.64 |
| 3/31/24 | 0.89 |
| 9/30/24 | Pending Next EPS Report |
| 6/30/24 | 37.36 |
| 3/31/24 | 38.12 |
| 9/30/24 | Pending Next EPS Report |
| 6/30/24 | 37.51 |
| 3/31/24 | 36.71 |
| 9/30/24 | Pending Next EPS Report |
| 6/30/24 | 50.90 |
| 3/31/24 | 49.66 |
| 9/30/24 | Pending Next EPS Report |
| 6/30/24 | 103.88 |
| 3/31/24 | 101.04 |
| 9/30/24 | Pending Next EPS Report |
| 6/30/24 | 21.21 |
| 3/31/24 | 19.23 |
| 9/30/24 | Pending Next EPS Report |
| 6/30/24 | 0.65 |
| 3/31/24 | 0.37 |
| 9/30/24 | Pending Next EPS Report |
| 6/30/24 | 39.27 |
| 3/31/24 | 26.90 |