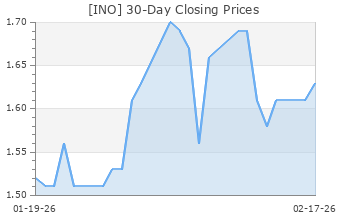
Inovio Pharmaceuticals (INO)
(Delayed Data from NSDQ)
$5.54 USD
+0.02 (0.36%)
Updated Nov 8, 2024 04:00 PM ET
After-Market: $5.55 +0.01 (0.18%) 7:58 PM ET
4-Sell of 5 4
F Value C Growth D Momentum F VGM
Company Summary
Inovio Pharmaceuticals, Inc., formerly known as Inovio Biomedical Corporation, is engaged in the discovery, development, and delivery of a new generation of vaccines, called DNA vaccines, focused on cancers and infectious diseases. The Company's electroporation DNA delivery technology uses brief, controlled electrical pulses to increase cellular DNA vaccine uptake. Inovio's clinical programs include human papillomavirus (HPV)/cervical cancer (therapeutic), avian influenza (preventative), hepatitis C virus (HCV) and human immunodeficiency virus (HIV) vaccines. It is advancing preclinical research for a universal seasonal/pandemic influenza vaccine. The Company's partners and collaborators include University of Pennsylvania, National Microbiology Laboratory of the Public Health Agency of Canada, NIAID, Merck, ChronTech, University of Southampton, and HIV Vaccines Trial Network. Inovio Pharmaceuticals, Inc. is headquartered in Blue Bell, Pennsylvania.
Company Summary
General Information
Inovio Pharmaceuticals, Inc
660 W. GERMANTOWN PIKE SUITE 110
PLYMOUTH MEETING, PA 19462
Phone: 267-440-4200
Fax: 267-440-4242
Email: investor.relations@inovio.com
| Industry | Medical - Biomedical and Genetics |
| Sector | Medical |
| Fiscal Year End | December |
| Last Reported Quarter | 9/30/2024 |
| Earnings Date | 11/14/2024 |
EPS Information
| Current Quarter EPS Consensus Estimate | -1.20 |
| Current Year EPS Consensus Estimate | -4.68 |
| Estimated Long-Term EPS Growth Rate | NA |
| Earnings Date | 11/14/2024 |
Price and Volume Information
| Zacks Rank | |
| Yesterday's Close | 5.52 |
| 52 Week High | 14.75 |
| 52 Week Low | 3.89 |
| Beta | 0.83 |
| 20 Day Moving Average | 249,920.70 |
| Target Price Consensus | 15.75 |

| 4 Week | 2.40 |
| 12 Week | -28.97 |
| YTD | -9.51 |
| 4 Week | -1.28 |
| 12 Week | -34.33 |
| YTD | -28.00 |
| Shares Outstanding (millions) | 25.96 |
| Market Capitalization (millions) | 143.84 |
| Short Ratio | NA |
| Last Split Date | 6/6/2014 |
| Dividend Yield | 0.00% |
| Annual Dividend | $0.00 |
| Payout Ratio | NA |
| Change in Payout Ratio | NA |
| Last Dividend Payout / Amount | NA / $0.00 |
Fundamental Ratios
| P/E (F1) | NA |
| Trailing 12 Months | NA |
| PEG Ratio | NA |
| vs. Previous Year (Q0/Q-4) | 23.75% |
| vs. Previous Quarter (Q0/Q-1) | 9.16% |
| vs. Previous Year (Q0/Q-4) | -55.31% |
| vs. Previous Quarter (Q0/Q-1) | NA% |
| Price/Book | 1.48 |
| Price/Cash Flow | NA |
| Price / Sales | 172.87 |
| 9/30/24 | Pending Next EPS Report |
| 6/30/24 | -99.51 |
| 3/31/24 | -88.13 |
| 9/30/24 | Pending Next EPS Report |
| 6/30/24 | -70.90 |
| 3/31/24 | -63.03 |
| 9/30/24 | Pending Next EPS Report |
| 6/30/24 | 4.45 |
| 3/31/24 | 4.77 |
| 9/30/24 | Pending Next EPS Report |
| 6/30/24 | 4.45 |
| 3/31/24 | 4.77 |
| 9/30/24 | NA |
| 6/30/24 | NA |
| 3/31/24 | NA |
| 9/30/24 | NA |
| 6/30/24 | NA |
| 3/31/24 | NA |
| 9/30/24 | Pending Next EPS Report |
| 6/30/24 | -20,545.32 |
| 3/31/24 | -17,423.72 |
| 9/30/24 | Pending Next EPS Report |
| 6/30/24 | 3.73 |
| 3/31/24 | 4.04 |
| 9/30/24 | NA |
| 6/30/24 | NA |
| 3/31/24 | NA |
| 9/30/24 | Pending Next EPS Report |
| 6/30/24 | 0.00 |
| 3/31/24 | 0.00 |
| 9/30/24 | Pending Next EPS Report |
| 6/30/24 | 0.00 |
| 3/31/24 | 0.00 |

