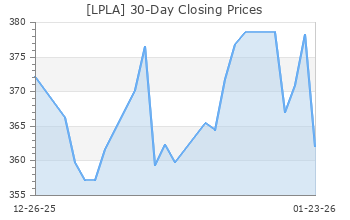
LPL Financial (LPLA)
(Delayed Data from NSDQ)
$314.54 USD
-0.14 (-0.04%)
Updated Nov 14, 2024 04:00 PM ET
After-Market: $314.40 -0.14 (-0.04%) 5:06 PM ET
3-Hold of 5 3
C Value F Growth D Momentum D VGM
Company Summary
LPL Financial Holdings Inc. is based in Boston, MA. It is a clearing broker-dealer and an investment advisory firm that acts as an agent for its advisors on behalf of their clients by providing access to a broad array of financial products and services.
LPL Financial conducts business through its subsidiaries. Some notable ones are:
LPL Financial LLC is a broker-dealer and an investment adviser, which clears and settles customer transactions.
Private Trust Company, N.A. offers trust administration, investment management oversight and Individual Retirement Account (IRA) custodial services.
<...
Company Summary
LPL Financial Holdings Inc. is based in Boston, MA. It is a clearing broker-dealer and an investment advisory firm that acts as an agent for its advisors on behalf of their clients by providing access to a broad array of financial products and services.
LPL Financial conducts business through its subsidiaries. Some notable ones are:
LPL Financial LLC is a broker-dealer and an investment adviser, which clears and settles customer transactions.
Private Trust Company, N.A. offers trust administration, investment management oversight and Individual Retirement Account (IRA) custodial services.
LPL Employee Services, LLC is a holding company for Allen & Company of Florida, LLC, a registered investment adviser (RIA) and Financial Resources Group Investment Services (FRGIS).
Fortigent Holdings Company provides solutions and consulting services to RIAs, banks and trust companies serving high-net-worth clients.
LPL Insurance Associates, Inc., operates as a brokerage general agency that offers life and disability insurance sales and services.
AW Subsidiary, Inc. is a holding company for AdvisoryWorld and Blaze Portfolio Systems LLC.
LPL Financial has been expanding through acquisitions. In 2011, the company acquired Concord Capital Partners, Inc. and certain assets of National Retirement Partners. In 2012, it purchased Fortigent. In 2017, it acquired certain assets and rights of National Planning Holdings, Inc.
In 2018, LPL Financial acquired all of the outstanding shares of AdvisoryWorld. In 2019, it acquired Allen & Company of Florida. In 2020, it acquired the assets of E.K. Riley Investments, Lucia Securities and Blaze Portfolio. In 2021, the company acquired Waddell & Reed's wealth management business. In 2023, it acquired FRGIS and the Private Client Group business of Boenning & Scattergood and took a 20% stake in Independent Advisor Alliance (IAA). In May 2024, it acquired Crown Capital, and in October 2024, it purchased Altria Wealth Solutions.
As of June 30, 2024, LPL Financial had total advisory assets of $829.1 billion and brokerage assets of $668.7 billion. As of the same date, it had cash and cash equivalents of $1.3 billion, total assets of $11.5 billion and total stockholders’ equity of $2.5 billion.
General Information
LPL Financial Holdings Inc
4707 EXECUTIVE DRIVE
SAN DIEGO, CA 92121
Phone: 800-877-7210
Fax: NA
Web: http://www.lpl.com
Email: investor.relations@lplfinancial.com
| Industry | Financial - Investment Bank |
| Sector | Finance |
| Fiscal Year End | December |
| Last Reported Quarter | 9/30/2024 |
| Exp Earnings Date | 2/6/2025 |
EPS Information
| Current Quarter EPS Consensus Estimate | 3.94 |
| Current Year EPS Consensus Estimate | 16.08 |
| Estimated Long-Term EPS Growth Rate | 12.70 |
| Exp Earnings Date | 2/6/2025 |
Price and Volume Information
| Zacks Rank | |
| Yesterday's Close | 314.68 |
| 52 Week High | 322.03 |
| 52 Week Low | 187.19 |
| Beta | 0.85 |
| 20 Day Moving Average | 856,364.31 |
| Target Price Consensus | 312.92 |

| 4 Week | 23.51 |
| 12 Week | 41.08 |
| YTD | 38.25 |
| 4 Week | 20.56 |
| 12 Week | 32.49 |
| YTD | 10.17 |
| Shares Outstanding (millions) | 74.88 |
| Market Capitalization (millions) | 23,563.11 |
| Short Ratio | NA |
| Last Split Date | NA |
| Dividend Yield | 0.38% |
| Annual Dividend | $1.20 |
| Payout Ratio | 0.08 |
| Change in Payout Ratio | -0.04 |
| Last Dividend Payout / Amount | NA / $0.00 |
Fundamental Ratios
| P/E (F1) | 19.57 |
| Trailing 12 Months | 19.97 |
| PEG Ratio | 1.54 |
| vs. Previous Year (Q0/Q-4) | 11.23% |
| vs. Previous Quarter (Q0/Q-1) | 7.22% |
| vs. Previous Year (Q0/Q-4) | 23.23% |
| vs. Previous Quarter (Q0/Q-1) | 6.02% |
| Price/Book | 8.49 |
| Price/Cash Flow | 14.99 |
| Price / Sales | 2.05 |
| 9/30/24 | 49.47 |
| 6/30/24 | 52.14 |
| 3/31/24 | 55.22 |
| 9/30/24 | 10.63 |
| 6/30/24 | 11.01 |
| 3/31/24 | 11.74 |
| 9/30/24 | 2.16 |
| 6/30/24 | 2.16 |
| 3/31/24 | 1.84 |
| 9/30/24 | 2.16 |
| 6/30/24 | 2.16 |
| 3/31/24 | 1.84 |
| 9/30/24 | 10.35 |
| 6/30/24 | 10.68 |
| 3/31/24 | 11.29 |
| 9/30/24 | 8.73 |
| 6/30/24 | 8.91 |
| 3/31/24 | 9.71 |
| 9/30/24 | 11.68 |
| 6/30/24 | 12.04 |
| 3/31/24 | 13.13 |
| 9/30/24 | 37.02 |
| 6/30/24 | 33.64 |
| 3/31/24 | 30.36 |
| 9/30/24 | NA |
| 6/30/24 | NA |
| 3/31/24 | NA |
| 9/30/24 | 1.60 |
| 6/30/24 | 1.77 |
| 3/31/24 | 1.70 |
| 9/30/24 | 61.58 |
| 6/30/24 | 63.85 |
| 3/31/24 | 62.93 |

