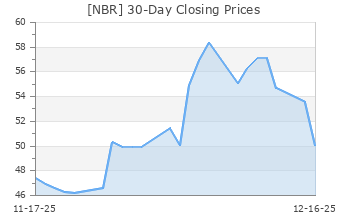
Nabors Industries (NBR)
(Delayed Data from NYSE)
$72.01 USD
-2.40 (-3.23%)
Updated Nov 1, 2024 04:00 PM ET
After-Market: $72.21 +0.20 (0.28%) 7:58 PM ET
3-Hold of 5 3
A Value A Growth F Momentum A VGM
Company Summary
Incorporated in 1978, Hamilton-based Nabors Industries Ltd. is one of the largest land-drilling contractors in the world, conducting oil, gas, and geothermal land drilling operations. The American multinational company – active across approximately 20 countries – primarily provides land-based and offshore drilling rigs that serves the oil and gas industry. The company has a 100% ownership interest in a venture in Saudi Arabia – Nabors Arabia – which actively markets rigs. As of Dec 31, 2023, Nabors’ fleet consisted of 319 units, including land-based operating rigs and offshore rigs.
The company offers a number of ancillary ...
Company Summary
Incorporated in 1978, Hamilton-based Nabors Industries Ltd. is one of the largest land-drilling contractors in the world, conducting oil, gas, and geothermal land drilling operations. The American multinational company – active across approximately 20 countries – primarily provides land-based and offshore drilling rigs that serves the oil and gas industry. The company has a 100% ownership interest in a venture in Saudi Arabia – Nabors Arabia – which actively markets rigs. As of Dec 31, 2023, Nabors’ fleet consisted of 319 units, including land-based operating rigs and offshore rigs.
The company offers a number of ancillary wellsite services, including oilfield management, engineering, transportation, construction, maintenance, well logging, and other support services in select domestic and international markets.
Nabors reports its operations in four major segments: U.S. Drilling, International Drilling, Drilling Solutions and Rig Technologies.
US Drilling: The firm’s U.S. operations comprise of drilling activities in the Lower 48 and Alaska along with offshore activities in Gulf of Mexico. As of Dec 31, 2023, the U.S. fleet consisted of a total of 187 rigs. Revenues from this segment accounted for 39% of the total sales in 2023.
International Drilling: Nabors has operations in almost every major energy-producing regions of the world. As of Dec 31, 2023, the fleet consisted of a total of 132 rigs. Revenues from this segment accounted for 43% of the total sales in 2023.
Drilling Solutions: The segment engages in providing specialized technology that optimizes drilling performance and wellbore placement. Revenues from this segment accounted for 10% of the total sales in 2023.
Rig Technologies: The segment deals in manufacturing drilling related equipment which are installed on both onshore and offshore drilling rigs. The unit also provides aftermarket sales and services for the installed base of its equipment. Revenues from this segment accounted for 8% of the total sales in 2023.
As of Dec 31, 2023, the company had $1.1 billion in cash and short-term investments and long-term debt of about $2.4 billion with total debt-to-total capital of 82.2%.
General Information
Nabors Industries Ltd
4 PAR-LA-VILLE ROAD SECOND FLOOR CROWN HOUSE
HAMILTON, D0 HM08
Phone: 441-292-1510
Fax: 441-292-1334
Email: william.conroy@nabors.com
| Industry | Oil and Gas - Drilling |
| Sector | Oils-Energy |
| Fiscal Year End | December |
| Last Reported Quarter | 9/30/2024 |
| Exp Earnings Date | 2/4/2025 |
EPS Information
| Current Quarter EPS Consensus Estimate | -1.43 |
| Current Year EPS Consensus Estimate | -12.77 |
| Estimated Long-Term EPS Growth Rate | NA |
| Exp Earnings Date | 2/4/2025 |
Price and Volume Information
| Zacks Rank | |
| Yesterday's Close | 74.41 |
| 52 Week High | 105.96 |
| 52 Week Low | 59.67 |
| Beta | 2.09 |
| 20 Day Moving Average | 346,741.34 |
| Target Price Consensus | 88.00 |

| 4 Week | -11.43 |
| 12 Week | -12.02 |
| YTD | -11.78 |
| 4 Week | -11.08 |
| 12 Week | -17.93 |
| YTD | -26.55 |
| Shares Outstanding (millions) | 9.55 |
| Market Capitalization (millions) | 687.60 |
| Short Ratio | NA |
| Last Split Date | 4/23/2020 |
| Dividend Yield | 0.00% |
| Annual Dividend | $0.00 |
| Payout Ratio | NA |
| Change in Payout Ratio | NA |
| Last Dividend Payout / Amount | NA / $0.00 |
Fundamental Ratios
| P/E (F1) | NA |
| Trailing 12 Months | NA |
| PEG Ratio | NA |
| vs. Previous Year (Q0/Q-4) | 37.96% |
| vs. Previous Quarter (Q0/Q-1) | 21.91% |
| vs. Previous Year (Q0/Q-4) | -0.11% |
| vs. Previous Quarter (Q0/Q-1) | 0.04% |
| Price/Book | 1.49 |
| Price/Cash Flow | 1.21 |
| Price / Sales | 0.23 |
| 9/30/24 | -25.68 |
| 6/30/24 | -28.10 |
| 3/31/24 | -23.52 |
| 9/30/24 | -2.73 |
| 6/30/24 | -3.08 |
| 3/31/24 | -2.71 |
| 9/30/24 | 1.88 |
| 6/30/24 | 1.82 |
| 3/31/24 | 1.78 |
| 9/30/24 | Pending Next EPS Report |
| 6/30/24 | 1.57 |
| 3/31/24 | 1.53 |
| 9/30/24 | -4.38 |
| 6/30/24 | -5.00 |
| 3/31/24 | -4.31 |
| 9/30/24 | -4.69 |
| 6/30/24 | -4.73 |
| 3/31/24 | -3.45 |
| 9/30/24 | 0.33 |
| 6/30/24 | 0.40 |
| 3/31/24 | 1.73 |
| 9/30/24 | 48.24 |
| 6/30/24 | 52.53 |
| 3/31/24 | 48.85 |
| 9/30/24 | 11.68 |
| 6/30/24 | 11.83 |
| 3/31/24 | 11.85 |
| 9/30/24 | 5.43 |
| 6/30/24 | 5.01 |
| 3/31/24 | 4.81 |
| 9/30/24 | 84.46 |
| 6/30/24 | 83.37 |
| 3/31/24 | 82.77 |

