Owens Corning (OC)
(Delayed Data from NYSE)
$174.54 USD
-1.98 (-1.12%)
Updated Oct 1, 2024 04:00 PM ET
After-Market: $174.50 -0.04 (-0.02%) 7:58 PM ET
5-Strong Sell of 5 5
B Value B Growth B Momentum A VGM
Company Summary
Owens Corning is a world leader in building materials systems and composite solutions. Since its inception in 1938, the company has evolved as a market-leading innovator of glass fiber technology. Its products include glass fiber that is used to support composite materials for transportation, electronics, marine, infrastructure, wind energy and other high-performance markets for insulation as well as roofing for residential, commercial and industrial applications.
The company has three reportable segments — Roofing, Insulation and Composites.
Roofing segment (accounting for 41.6% of total 2023 sales) products include laminate and strip asphalt roofing shingles, roofing components, ...
Company Summary
Owens Corning is a world leader in building materials systems and composite solutions. Since its inception in 1938, the company has evolved as a market-leading innovator of glass fiber technology. Its products include glass fiber that is used to support composite materials for transportation, electronics, marine, infrastructure, wind energy and other high-performance markets for insulation as well as roofing for residential, commercial and industrial applications.
The company has three reportable segments — Roofing, Insulation and Composites.
Roofing segment (accounting for 41.6% of total 2023 sales) products include laminate and strip asphalt roofing shingles, roofing components, synthetic packaging materials and oxidized asphalt. Demand for products in the Roofing segment is generally driven by residential repair and remodeling activity and by new residential construction. Roofing damage from major storms can significantly increase demand in the segment.
Insulation segment (37.9%) products include thermal and acoustical batts, loose-fill insulation, foam sheathing and accessories, glass fiber pipe insulation, energy efficient flexible duct media, bonded and granulated mineral wool insulation, cellular glass insulation as well as foam insulation. Demand for Owens Corning’s insulating products is driven by new residential construction, remodeling and repair activity, commercial and industrial construction activity, increasingly stringent building codes and the growing need for energy efficiency.
Composites segment (23.6%) includes vertically integrated downstream activities and specializes in the production of glass fiber reinforcement materials. Demand for composites is driven by general global economic activity and by the increasing replacement of traditional materials such as aluminum, wood and steel with composites that offer lighter weight, improved strength, lack of conductivity and corrosion resistance.
[Note: For 2023, corporate eliminations constituted 3.1% of net sales]
General Information
Owens Corning Inc
ONE OWENS CORNING PARKWAY
TOLEDO, OH 43659
Phone: 419-248-8000
Fax: 419-248-8445
Web: http://www.owenscorning.com
Email: amber.wohlfarth@owenscorning.com
| Industry | Building Products - Miscellaneous |
| Sector | Construction |
| Fiscal Year End | December |
| Last Reported Quarter | 9/30/2024 |
| Exp Earnings Date | 10/23/2024 |
EPS Information
| Current Quarter EPS Consensus Estimate | 4.01 |
| Current Year EPS Consensus Estimate | 15.39 |
| Estimated Long-Term EPS Growth Rate | 3.30 |
| Exp Earnings Date | 10/23/2024 |
Price and Volume Information
| Zacks Rank | |
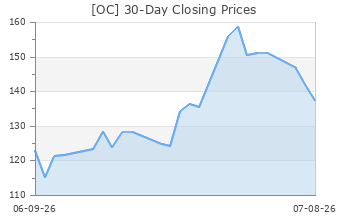
| Yesterday's Close | 176.52 |
| 52 Week High | 191.13 |
| 52 Week Low | 109.95 |
| Beta | 1.41 |
| 20 Day Moving Average | 748,920.12 |
| Target Price Consensus | 189.08 |
| 4 Week | 4.62 |
| 12 Week | 5.49 |
| YTD | 19.08 |
| 4 Week | 2.55 |
| 12 Week | 2.01 |
| YTD | -1.43 |
| Shares Outstanding (millions) | 86.95 |
| Market Capitalization (millions) | 15,348.12 |
| Short Ratio | NA |
| Last Split Date | NA |
| Dividend Yield | 1.36% |
| Annual Dividend | $2.40 |
| Payout Ratio | 0.15 |
| Change in Payout Ratio | 0.00 |
| Last Dividend Payout / Amount | 7/15/2024 / $0.60 |
Fundamental Ratios
| P/E (F1) | 11.47 |
| Trailing 12 Months | 11.32 |
| PEG Ratio | 3.51 |
| vs. Previous Year | 9.95% |
| vs. Previous Quarter | 29.25% |
| vs. Previous Year | 8.82% |
| vs. Previous Quarter | 21.26% |
| Price/Book | 2.77 |
| Price/Cash Flow | 8.17 |
| Price / Sales | 1.55 |
| 6/30/24 | 26.33 |
| 3/31/24 | 26.52 |
| 12/31/23 | 25.88 |
| 6/30/24 | 11.43 |
| 3/31/24 | 12.25 |
| 12/31/23 | 11.81 |
| 6/30/24 | 1.37 |
| 3/31/24 | 1.76 |
| 12/31/23 | 1.69 |
| 6/30/24 | 0.79 |
| 3/31/24 | 1.22 |
| 12/31/23 | 1.17 |
| 6/30/24 | 14.06 |
| 3/31/24 | 14.15 |
| 12/31/23 | 13.48 |
| 6/30/24 | 10.66 |
| 3/31/24 | 11.53 |
| 12/31/23 | 12.36 |
| 6/30/24 | 14.13 |
| 3/31/24 | 15.19 |
| 12/31/23 | 16.44 |
| 6/30/24 | 63.76 |
| 3/31/24 | 60.55 |
| 12/31/23 | 58.34 |
| 6/30/24 | 5.36 |
| 3/31/24 | 5.58 |
| 12/31/23 | 5.53 |
| 6/30/24 | 0.91 |
| 3/31/24 | 0.50 |
| 12/31/23 | 0.50 |
| 6/30/24 | 47.60 |
| 3/31/24 | 33.72 |
| 12/31/23 | 33.74 |