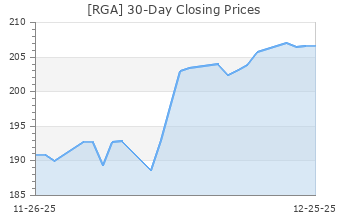
Reinsurance Group of America (RGA)
(Delayed Data from NYSE)
$226.71 USD
-1.28 (-0.56%)
Updated Feb 4, 2025 04:00 PM ET
After-Market: $224.25 -2.46 (-1.09%) 7:58 PM ET
2-Buy of 5 2
A Value B Growth D Momentum A VGM
Company Summary
Formed in 1992 in Timberlake, MO, Reinsurance Group of America Inc. is a leading global provider of traditional life and health reinsurance and financial solutions with operations in the United States, Latin America, Canada, Europe, the Middle East, Africa, Asia and Australia.
Its Traditional reinsurance includes individual and group life and health, disability, and critical illness reinsurance. Life reinsurance primarily refers to reinsurance of individual or group-issued term, whole life, universal life, and joint and last survivor insurance policies. Health and disability reinsurance primarily refers to reinsurance of individual or group health policies. Critical illness ...
Company Summary
Formed in 1992 in Timberlake, MO, Reinsurance Group of America Inc. is a leading global provider of traditional life and health reinsurance and financial solutions with operations in the United States, Latin America, Canada, Europe, the Middle East, Africa, Asia and Australia.
Its Traditional reinsurance includes individual and group life and health, disability, and critical illness reinsurance. Life reinsurance primarily refers to reinsurance of individual or group-issued term, whole life, universal life, and joint and last survivor insurance policies. Health and disability reinsurance primarily refers to reinsurance of individual or group health policies. Critical illness reinsurance provides a benefit in the event of the diagnosis of a pre-defined critical illness. Its Financial solutions include longevity reinsurance, asset-intensive reinsurance, financial reinsurance and stable value products.
Reinsurance Group reports through four geographic segments:
U.S. and Latin America (54.8% of 2023 Net Premiums) – Segmented into traditional and non-traditional businesses, namely individual life, long-term care, group life and health reinsurance, annuity and financial reinsurance products. The non-traditional business also issues fee-based synthetic guaranteed investment contracts such as investment-only, stable-value contracts, to retirement plans.
Canada Operations (9.5%) – Reinsures traditional life products and creditor reinsurance, group life and health reinsurance, non-guaranteed critical illness products, and longevity reinsurance.
Europe, Middle East and Africa (13.9%) – Includes a variety of life and health products, critical illness and longevity business throughout Europe and in South Africa, in addition to other markets.
Asia Pacific (21.8%) – Includes life, critical illness, health, disability, superannuation and financial reinsurance.
Corporate and Other – Includes results from, among others, RGA Technology Partners, Inc., a wholly owned subsidiary that develops and markets technology solutions for the insurance industry, interest expense related to debt and investment income and expense associated with the company’s collateral finance facility.
General Information
Reinsurance Group of America, Incorporated
16600 SWINGLEY RIDGE ROAD
CHESTERFIELD, MO 63017
Phone: 636-736-7000
Fax: 636-736-7100
Web: http://www.rgare.com
Email: investrelations@rgare.com
| Industry | Insurance - Life Insurance |
| Sector | Finance |
| Fiscal Year End | December |
| Last Reported Quarter | 12/31/2024 |
| Earnings Date | 2/6/2025 |
EPS Information
| Current Quarter EPS Consensus Estimate | 5.22 |
| Current Year EPS Consensus Estimate | 21.45 |
| Estimated Long-Term EPS Growth Rate | NA |
| Earnings Date | 2/6/2025 |
Price and Volume Information
| Zacks Rank | |
| Yesterday's Close | 227.99 |
| 52 Week High | 233.81 |
| 52 Week Low | 165.38 |
| Beta | 0.93 |
| 20 Day Moving Average | 346,910.75 |
| Target Price Consensus | 255.36 |

| 4 Week | 2.24 |
| 12 Week | -0.94 |
| YTD | 6.12 |
| 4 Week | 0.06 |
| 12 Week | -1.82 |
| YTD | 4.71 |
| Shares Outstanding (millions) | 65.86 |
| Market Capitalization (millions) | 14,932.10 |
| Short Ratio | NA |
| Last Split Date | 3/1/1999 |
| Dividend Yield | 1.57% |
| Annual Dividend | $3.56 |
| Payout Ratio | 0.16 |
| Change in Payout Ratio | -0.31 |
| Last Dividend Payout / Amount | 11/8/2024 / $0.89 |
Fundamental Ratios
| P/E (F1) | 9.79 |
| Trailing 12 Months | 10.14 |
| PEG Ratio | NA |
| vs. Previous Year (Q0/Q-4) | 10.05% |
| vs. Previous Quarter (Q0/Q-1) | 11.86% |
| vs. Previous Year (Q0/Q-4) | 9.66% |
| vs. Previous Quarter (Q0/Q-1) | 15.85% |
| Price/Book | 1.33 |
| Price/Cash Flow | 11.97 |
| Price / Sales | 0.68 |
| 12/31/24 | Pending Next EPS Report |
| 9/30/24 | 15.01 |
| 6/30/24 | 15.84 |
| 12/31/24 | Pending Next EPS Report |
| 9/30/24 | 1.38 |
| 6/30/24 | 1.45 |
| 12/31/24 | Pending Next EPS Report |
| 9/30/24 | 0.17 |
| 6/30/24 | 0.17 |
| 12/31/24 | Pending Next EPS Report |
| 9/30/24 | 0.17 |
| 6/30/24 | 0.17 |
| 12/31/24 | Pending Next EPS Report |
| 9/30/24 | 6.82 |
| 6/30/24 | 6.80 |
| 12/31/24 | Pending Next EPS Report |
| 9/30/24 | 3.32 |
| 6/30/24 | 4.01 |
| 12/31/24 | Pending Next EPS Report |
| 9/30/24 | 4.20 |
| 6/30/24 | 5.08 |
| 12/31/24 | Pending Next EPS Report |
| 9/30/24 | 170.30 |
| 6/30/24 | 149.33 |
| 12/31/24 | NA |
| 9/30/24 | NA |
| 6/30/24 | NA |
| 12/31/24 | Pending Next EPS Report |
| 9/30/24 | 0.45 |
| 6/30/24 | 0.52 |
| 12/31/24 | Pending Next EPS Report |
| 9/30/24 | 31.12 |
| 6/30/24 | 34.03 |

