Starbucks (SBUX)
(Delayed Data from NSDQ)
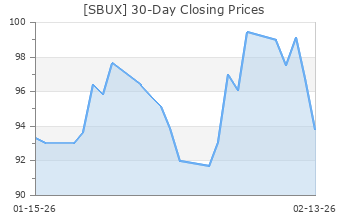
$98.87 USD
+1.17 (1.20%)
Updated Nov 1, 2024 03:59 PM ET
After-Market: $98.87 0.00 (0.00%) 7:58 PM ET
5-Strong Sell of 5 5
F Value C Growth F Momentum F VGM
Company Summary
Founded in 1985 and based in Seattle, WA, Starbucks Corporation is the leading roaster and retailer of specialty coffee globally. In addition to fresh, rich-brewed coffees, Starbucks’ offerings include many complimentary food items and a selection of premium teas and other beverages, sold mainly through the company’s retail stores. The company’s popular brands include Starbucks coffee, Teavana tea, Seattle's Best Coffee, La Boulange bakery products and Evolution Fresh juices.
Other than the company’s own retail stores, it generates revenues through licensed stores, consumer packaged goods and foodservice ...
Company Summary
Founded in 1985 and based in Seattle, WA, Starbucks Corporation is the leading roaster and retailer of specialty coffee globally. In addition to fresh, rich-brewed coffees, Starbucks’ offerings include many complimentary food items and a selection of premium teas and other beverages, sold mainly through the company’s retail stores. The company’s popular brands include Starbucks coffee, Teavana tea, Seattle's Best Coffee, La Boulange bakery products and Evolution Fresh juices.
Other than the company’s own retail stores, it generates revenues through licensed stores, consumer packaged goods and foodservice operations. The company receives royalties and license fees from the U.S. and international licensed stores. Under its consumer packaged goods operations, Starbucks sells packed coffee and tea products as well as a variety of ready-to-drink beverages and single-serve coffee and tea products to grocery, warehouse clubs and specialty retail stores. It also includes revenues from licensing deals with many partners to produce and sell its Starbucks and Seattle's Best Coffee branded products.
During fourth-quarter fiscal 2021, the company initiated certain changes related to its operating segment structure. The company renamed the Americas segment to North America operating segment, featuring company-operated and licensed stores in the United States and Canada. Starbucks realigned the licensed Latin America and Caribbean markets from the earlier Americas segment to the International segment. The company’s latest reportable operating segments comprise North America (73.9% of total revenues in fiscal 2023); International (20.8%); and Channel Development (CD — 5.3%).
The CD segment is not a geographic region but an entirely different channel (it is a combination of the consumer packaged goods or CPG and foodservice businesses). It includes roasted whole bean and ground coffees, premium Tazo teas, a variety of ready-to-drink beverages (like Frappuccino and Starbucks Refreshers) and Starbucks and Tazo branded K-Cup packs sold through channels such as grocery, specialty retailers, and foodservice to name a few.
General Information
Starbucks Corporation
2401 Utah Avenue South
SEATTLE, WA 98134
Phone: 206-447-1575
Fax: 206-318-3432
Email: investorrelations@starbucks.com
| Industry | Retail - Restaurants |
| Sector | Retail-Wholesale |
| Fiscal Year End | September |
| Last Reported Quarter | 9/30/2024 |
| Exp Earnings Date | 2/4/2025 |
EPS Information
| Current Quarter EPS Consensus Estimate | 0.70 |
| Current Year EPS Consensus Estimate | 3.22 |
| Estimated Long-Term EPS Growth Rate | 9.70 |
| Exp Earnings Date | 2/4/2025 |
Price and Volume Information
| Zacks Rank | |
| Yesterday's Close | 97.70 |
| 52 Week High | 107.66 |
| 52 Week Low | 71.55 |
| Beta | 0.97 |
| 20 Day Moving Average | 7,546,340.00 |
| Target Price Consensus | 102.56 |

| 4 Week | 2.37 |
| 12 Week | 31.67 |
| YTD | 2.98 |
| 4 Week | 2.77 |
| 12 Week | 22.83 |
| YTD | -14.26 |
| Shares Outstanding (millions) | 1,133.20 |
| Market Capitalization (millions) | 112,039.48 |
| Short Ratio | NA |
| Last Split Date | 4/9/2015 |
| Dividend Yield | 2.31% |
| Annual Dividend | $2.28 |
| Payout Ratio | 0.69 |
| Change in Payout Ratio | -0.11 |
| Last Dividend Payout / Amount | 8/16/2024 / $0.57 |
Fundamental Ratios
| P/E (F1) | 30.67 |
| Trailing 12 Months | 29.87 |
| PEG Ratio | 3.17 |
| vs. Previous Year (Q0/Q-4) | -24.53% |
| vs. Previous Quarter (Q0/Q-1) | -13.98% |
| vs. Previous Year (Q0/Q-4) | -3.20% |
| vs. Previous Quarter (Q0/Q-1) | -0.44% |
| Price/Book | NA |
| Price/Cash Flow | 20.93 |
| Price / Sales | 3.10 |
| 9/30/24 | -46.39 |
| 6/30/24 | -49.38 |
| 3/31/24 | -49.91 |
| 9/30/24 | 12.54 |
| 6/30/24 | 13.79 |
| 3/31/24 | 14.27 |
| 9/30/24 | 0.75 |
| 6/30/24 | 0.89 |
| 3/31/24 | 0.86 |
| 9/30/24 | Pending Next EPS Report |
| 6/30/24 | 0.65 |
| 3/31/24 | 0.63 |
| 9/30/24 | 10.40 |
| 6/30/24 | 11.16 |
| 3/31/24 | 11.40 |
| 9/30/24 | 10.40 |
| 6/30/24 | 11.16 |
| 3/31/24 | 11.38 |
| 9/30/24 | 13.74 |
| 6/30/24 | 14.72 |
| 3/31/24 | 14.86 |
| 9/30/24 | -6.57 |
| 6/30/24 | -7.00 |
| 3/31/24 | -7.45 |
| 9/30/24 | 6.37 |
| 6/30/24 | 6.41 |
| 3/31/24 | 6.36 |
| 9/30/24 | NA |
| 6/30/24 | NA |
| 3/31/24 | NA |
| 9/30/24 | NA |
| 6/30/24 | NA |
| 3/31/24 | NA |

