TMobile US (TMUS)
(Delayed Data from NSDQ)
$208.28 USD
+0.25 (0.12%)
Updated Oct 4, 2024 04:00 PM ET
After-Market: $208.28 0.00 (0.00%) 7:58 PM ET
3-Hold of 5 3
C Value B Growth F Momentum C VGM
Company Summary
Founded in 1994 and headquartered in Bellevue, WA, T-Mobile US, Inc. is a national wireless service provider. The company offers its services under the T-Mobile, Metro by T-Mobile and Sprint brands. T-Mobile, through its subsidiaries, provides wireless services for branded postpaid and prepaid, and wholesale customers.
The company was formed after the merger of T-Mobile USA Inc. and MetroPCS Communications Inc. Deutsche Telekom AG was the owner of the former T-Mobile USA Inc. Under the terms of the business combination with MetroPCS, Deutsche Telekom received shares of common stock representing a majority ...
Company Summary
Founded in 1994 and headquartered in Bellevue, WA, T-Mobile US, Inc. is a national wireless service provider. The company offers its services under the T-Mobile, Metro by T-Mobile and Sprint brands. T-Mobile, through its subsidiaries, provides wireless services for branded postpaid and prepaid, and wholesale customers.
The company was formed after the merger of T-Mobile USA Inc. and MetroPCS Communications Inc. Deutsche Telekom AG was the owner of the former T-Mobile USA Inc. Under the terms of the business combination with MetroPCS, Deutsche Telekom received shares of common stock representing a majority ownership interest in T-Mobile in exchange for its transfer of all of T-Mobile USA’s common stock.
The company offers mobile voice, messaging and data services in the postpaid, prepaid and wholesale markets. T-Mobile is extensively deploying 5G and 4G LTE (Long-Term Evolution) networks. It also provides wireless devices, such as smartphones, tablets and other mobile communication devices and accessories manufactured by various suppliers. T-Mobile’s business largely depends on its “Un-carrier Value Proposition”, which aims to enhance customer satisfaction by means of providing latest products at cheaper rates and uncomplicated terms of conditions.
T-Mobile mainly reports under the following two segments.
Service (80.5% of total revenues in 2023): Includes wireless communication services to branded postpaid and branded prepaid customers through a variety of service plan options.
Equipment (18%): Includes sale of devices to dealers and third-party distributors for resale through independent third-party retail outlets; while the balance accounts for Other (1.5%).
T-Mobile recorded 5.7 million postpaid net customer additions and 3.1 million postpaid phone net customer additions in fiscal 2023. Moreover, the postpaid phone churn rate was at a record low level of 0.87% and high-speed Internet net customer additions totaled 2.1 million in fiscal 2023.
General Information
TMobile US, Inc
12920 SE 38TH STREET
BELLEVUE, WA 98006
Phone: 425-378-4000
Fax: 214-570-5859
Email: investor.relations@t-mobile.com
| Industry | Wireless National |
| Sector | Computer and Technology |
| Fiscal Year End | December |
| Last Reported Quarter | 9/30/2024 |
| Earnings Date | 10/23/2024 |
EPS Information
| Current Quarter EPS Consensus Estimate | 2.34 |
| Current Year EPS Consensus Estimate | 9.14 |
| Estimated Long-Term EPS Growth Rate | 20.60 |
| Earnings Date | 10/23/2024 |
Price and Volume Information
| Zacks Rank | |
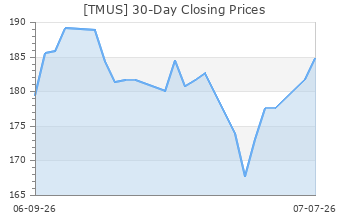
| Yesterday's Close | 208.03 |
| 52 Week High | 209.26 |
| 52 Week Low | 136.84 |
| Beta | 0.51 |
| 20 Day Moving Average | 4,182,716.50 |
| Target Price Consensus | 220.15 |
| 4 Week | 5.63 |
| 12 Week | 16.48 |
| YTD | 29.91 |
| 4 Week | 1.08 |
| 12 Week | 13.11 |
| YTD | 8.58 |
| Shares Outstanding (millions) | 1,166.78 |
| Market Capitalization (millions) | 243,017.78 |
| Short Ratio | NA |
| Last Split Date | 5/1/2013 |
| Dividend Yield | 1.25% |
| Annual Dividend | $2.60 |
| Payout Ratio | 0.33 |
| Change in Payout Ratio | 0.27 |
| Last Dividend Payout / Amount | 8/30/2024 / $0.65 |
Fundamental Ratios
| P/E (F1) | 22.80 |
| Trailing 12 Months | 26.10 |
| PEG Ratio | 1.10 |
| vs. Previous Year | 33.87% |
| vs. Previous Quarter | 24.50% |
| vs. Previous Year | 3.00% |
| vs. Previous Quarter | 0.91% |
| Price/Book | 3.88 |
| Price/Cash Flow | 11.40 |
| Price / Sales | 3.07 |
| 9/30/24 | Pending Next EPS Report |
| 6/30/24 | 14.88 |
| 3/31/24 | 13.61 |
| 9/30/24 | Pending Next EPS Report |
| 6/30/24 | 4.55 |
| 3/31/24 | 4.20 |
| 9/30/24 | Pending Next EPS Report |
| 6/30/24 | 0.84 |
| 3/31/24 | 0.94 |
| 9/30/24 | Pending Next EPS Report |
| 6/30/24 | 0.78 |
| 3/31/24 | 0.86 |
| 9/30/24 | Pending Next EPS Report |
| 6/30/24 | 11.95 |
| 3/31/24 | 11.15 |
| 9/30/24 | Pending Next EPS Report |
| 6/30/24 | 11.95 |
| 3/31/24 | 11.15 |
| 9/30/24 | Pending Next EPS Report |
| 6/30/24 | 15.67 |
| 3/31/24 | 14.73 |
| 9/30/24 | Pending Next EPS Report |
| 6/30/24 | 53.68 |
| 3/31/24 | 52.97 |
| 9/30/24 | Pending Next EPS Report |
| 6/30/24 | 18.94 |
| 3/31/24 | 18.94 |
| 9/30/24 | Pending Next EPS Report |
| 6/30/24 | 1.22 |
| 3/31/24 | 1.25 |
| 9/30/24 | Pending Next EPS Report |
| 6/30/24 | 55.00 |
| 3/31/24 | 55.61 |