VALE (VALE)
(Delayed Data from NYSE)
$10.61 USD
+0.17 (1.63%)
Updated Aug 26, 2024 04:00 PM ET
After-Market: $10.61 0.00 (0.00%) 7:58 PM ET
3-Hold of 5 3
A Value D Growth C Momentum B VGM
Company Summary
Brazil-based Vale S.A. is one of the world’s largest mining companies with a market capitalization of approximately $58 billion. It produces iron ore, iron ore pellets, copper, nickel. and also has operations in manganese, ferroalloys, gold, silver, and cobalt.
Vale has a logistics network integrating mines, railroads, ports and ships, which has provided it an edge in the iron ore market. The company has through the years distributed its products to various countries in an efficient way at significantly lower costs. Vale supplies its iron ore and iron ore ...
Company Summary
Brazil-based Vale S.A. is one of the world’s largest mining companies with a market capitalization of approximately $58 billion. It produces iron ore, iron ore pellets, copper, nickel. and also has operations in manganese, ferroalloys, gold, silver, and cobalt.
Vale has a logistics network integrating mines, railroads, ports and ships, which has provided it an edge in the iron ore market. The company has through the years distributed its products to various countries in an efficient way at significantly lower costs. Vale supplies its iron ore and iron ore pellets to the steel industry.
Vale is focusing on product line to capture industry trends, improving quality and productivity and controlling costs. Its diversified portfolio of high-quality products, strong technical marketing strategy, efficient logistics and long-standing relationships with major customers provides it a competitive edge.
In 2019, the Brumadinho dam rupture impacted production and also its reputation. The company has since been striving to prevent further accidents through improved standards and accelerated decommissioning of upstream dams. Since 2019, Vale has eliminated 14 out of the 30 upstream dams. As a supplementary safety provision throughout the de-characterization works, Vale built four backup dams to serve dams considered critical.
In the second quarter of 2023, Vale delivered on its commitment and implemented Global Industry Standard on Tailings Management (GISTM) for its prioritized tailings facilities. This is an important milestone in the evolution of dam management and the safety of its operations and surrounding communities. Currently, the company has implemented the GISTM for 48 tailings facilities, 37 of them located in Brazil and 11 in Canada, with actions plans in place. By August 2025, all 50 tailings facilities will be in conformance.
Vale's principal lines of businesses are Iron Solutions and Energy Transition Materials.
Iron Solutions generated 82% of total revenues in 2023. Vale operates four systems in Brazil for producing and distributing iron ore.
Energy Transition Materials accounted for 18% of revenues in 2023. The business includes exploration efforts related to nickel and copper.
General Information
VALE SA
Praia de Botafogo186-offices 1101 1601 1701 and 1801- Botafogo
RIO DE JANEIRO, D5 22250
Phone: 55-21-3485-5000
Fax: 55-21-3814-8820
Web: http://www.vale.com
Email: vale.ri@vale.com
| Industry | Mining - Iron |
| Sector | Basic Materials |
| Fiscal Year End | December |
| Last Reported Quarter | 6/30/2024 |
| Exp Earnings Date | 10/24/2024 |
EPS Information
| Current Quarter EPS Consensus Estimate | 0.54 |
| Current Year EPS Consensus Estimate | 2.13 |
| Estimated Long-Term EPS Growth Rate | 1.40 |
| Exp Earnings Date | 10/24/2024 |
Price and Volume Information
| Zacks Rank | |
| Yesterday's Close | 10.44 |
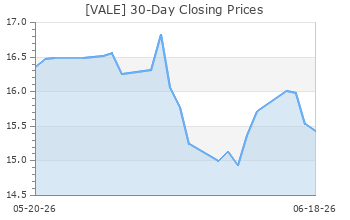
| 52 Week High | 16.08 |
| 52 Week Low | 9.66 |
| Beta | 0.96 |
| 20 Day Moving Average | 29,665,184.00 |
| Target Price Consensus | 15.75 |
| 4 Week | -3.87 |
| 12 Week | -13.36 |
| YTD | -34.17 |
| 4 Week | -6.86 |
| 12 Week | -18.85 |
| YTD | -44.28 |
| Shares Outstanding (millions) | 4,483.08 |
| Market Capitalization (millions) | 46,803.34 |
| Short Ratio | NA |
| Last Split Date | 9/13/2007 |
| Dividend Yield | 11.12% |
| Annual Dividend | $1.16 |
| Payout Ratio | 0.58 |
| Change in Payout Ratio | 0.25 |
| Last Dividend Payout / Amount | 8/5/2024 / $0.31 |
Fundamental Ratios
| P/E (F1) | 4.91 |
| Trailing 12 Months | 5.12 |
| PEG Ratio | 3.56 |
| vs. Previous Year | 115.00% |
| vs. Previous Quarter | 10.26% |
| vs. Previous Year | 2.55% |
| vs. Previous Quarter | 17.27% |
| Price/Book | 1.22 |
| Price/Cash Flow | 4.23 |
| Price / Sales | 1.11 |
| 6/30/24 | 22.23 |
| 3/31/24 | 19.59 |
| 12/31/23 | 20.00 |
| 6/30/24 | 9.71 |
| 3/31/24 | 8.54 |
| 12/31/23 | 8.82 |
| 6/30/24 | 1.08 |
| 3/31/24 | 1.12 |
| 12/31/23 | 1.28 |
| 6/30/24 | 0.73 |
| 3/31/24 | 0.79 |
| 12/31/23 | 0.96 |
| 6/30/24 | 20.86 |
| 3/31/24 | 18.72 |
| 12/31/23 | 19.10 |
| 6/30/24 | 23.07 |
| 3/31/24 | 18.72 |
| 12/31/23 | 19.10 |
| 6/30/24 | 26.17 |
| 3/31/24 | 26.29 |
| 12/31/23 | 26.69 |
| 6/30/24 | 8.56 |
| 3/31/24 | 8.70 |
| 12/31/23 | 9.14 |
| 6/30/24 | 5.04 |
| 3/31/24 | 4.86 |
| 12/31/23 | 4.82 |
| 6/30/24 | 0.43 |
| 3/31/24 | 0.41 |
| 12/31/23 | 0.38 |
| 6/30/24 | 30.05 |
| 3/31/24 | 28.85 |
| 12/31/23 | 27.80 |