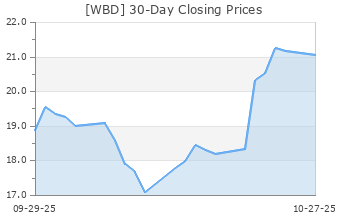
Warner Bros. Discovery (WBD)
(Real Time Quote from BATS)
$8.25 USD
+0.02 (0.24%)
Updated Nov 4, 2024 01:34 PM ET
5-Strong Sell of 5 5
C Value B Growth D Momentum C VGM
Company Summary
Headquartered in New York, Warner Bros. Discovery is a premier global media and entertainment company that combines WarnerMedia Business’s premium entertainment, sports and news assets with Discovery’s leading non-fiction and international entertainment and sports businesses, thus offering audiences a differentiated portfolio of content, brands and franchises across television, film, streaming and gaming.
On Apr 8, 2022, Discovery completed its merger with the WarnerMedia business of AT&T and rebranded itself as Warner Bros. Discovery, Inc. Following this merger, the company's shares began trading on the Nasdaq Global Select Market under ...
Company Summary
Headquartered in New York, Warner Bros. Discovery is a premier global media and entertainment company that combines WarnerMedia Business’s premium entertainment, sports and news assets with Discovery’s leading non-fiction and international entertainment and sports businesses, thus offering audiences a differentiated portfolio of content, brands and franchises across television, film, streaming and gaming.
On Apr 8, 2022, Discovery completed its merger with the WarnerMedia business of AT&T and rebranded itself as Warner Bros. Discovery, Inc. Following this merger, the company's shares began trading on the Nasdaq Global Select Market under the trading symbol WBD on Apr 11, 2022.
The company generated revenues of $41.3 billion in 2023. Studios revenues were $12.2 billion. Networks revenues were $21.2 billion. DTC revenues were $10.2 billion.
Advertising revenues are principally generated from the sale of commercial time on linear (television networks and authenticated TVE applications) and digital platforms (DTC subscription services and websites), and sold primarily on a national basis in the United States and on a pan-regional or local-language feed basis outside the United States. Advertising revenues increased 2% in 2023.
Distribution revenues are generated from fees charged to network distributors, which include cable, DTH satellite, telecommunications and digital service providers, and DTC subscribers. Distribution revenues increased 25% in 2023. As of Dec 31, 2023, WBD had 97.7 million DTC subscribers.
Content revenues are generated from the release of feature films for initial exhibition in theaters, the licensing of feature films and television programs to various television, SVOD and other digital markets, distribution of feature films and television programs in the physical and digital home entertainment market, sales of console games and mobile in-game content, sublicensing of sports rights, and licensing of intellectual property such as characters and brands. Content revenues increased 34% in 2023.
Other revenues primarily consist of studio production services and tours. Other revenues increased 49% in 2023.
General Information
Warner Bros Discovery, Inc
230 PARK AVENUE SOUTH
NEW YORK, NY 10003
Phone: 212-548-5555
Fax: 240-662-1868
Web: https://wbd.com
Email: andrew.slabin@wbd.com
| Industry | Broadcast Radio and Television |
| Sector | Consumer Discretionary |
| Fiscal Year End | December |
| Last Reported Quarter | 9/30/2024 |
| Earnings Date | 11/7/2024 |
EPS Information
| Current Quarter EPS Consensus Estimate | -0.05 |
| Current Year EPS Consensus Estimate | -4.50 |
| Estimated Long-Term EPS Growth Rate | 12.10 |
| Earnings Date | 11/7/2024 |
Price and Volume Information
| Zacks Rank | |
| Yesterday's Close | 8.23 |
| 52 Week High | 12.70 |
| 52 Week Low | 6.64 |
| Beta | 1.48 |
| 20 Day Moving Average | 22,657,824.00 |
| Target Price Consensus | 10.07 |

| 4 Week | 5.78 |
| 12 Week | 17.15 |
| YTD | -27.68 |
| 4 Week | 6.20 |
| 12 Week | 9.29 |
| YTD | -39.79 |
| Shares Outstanding (millions) | 2,451.91 |
| Market Capitalization (millions) | 20,179.21 |
| Short Ratio | NA |
| Last Split Date | NA |
| Dividend Yield | 0.00% |
| Annual Dividend | $0.00 |
| Payout Ratio | NA |
| Change in Payout Ratio | NA |
| Last Dividend Payout / Amount | NA / $0.00 |
Fundamental Ratios
| P/E (F1) | NA |
| Trailing 12 Months | NA |
| PEG Ratio | NA |
| vs. Previous Year (Q0/Q-4) | -698.04% |
| vs. Previous Quarter (Q0/Q-1) | -917.50% |
| vs. Previous Year (Q0/Q-4) | -6.23% |
| vs. Previous Quarter (Q0/Q-1) | -2.46% |
| Price/Book | 0.57 |
| Price/Cash Flow | 0.96 |
| Price / Sales | 0.51 |
| 9/30/24 | Pending Next EPS Report |
| 6/30/24 | -27.28 |
| 3/31/24 | -6.58 |
| 9/30/24 | Pending Next EPS Report |
| 6/30/24 | -9.92 |
| 3/31/24 | -2.44 |
| 9/30/24 | Pending Next EPS Report |
| 6/30/24 | 0.76 |
| 3/31/24 | 0.82 |
| 9/30/24 | Pending Next EPS Report |
| 6/30/24 | 0.76 |
| 3/31/24 | 0.82 |
| 9/30/24 | Pending Next EPS Report |
| 6/30/24 | -29.47 |
| 3/31/24 | -7.45 |
| 9/30/24 | Pending Next EPS Report |
| 6/30/24 | -29.47 |
| 3/31/24 | -7.45 |
| 9/30/24 | Pending Next EPS Report |
| 6/30/24 | -30.05 |
| 3/31/24 | -8.49 |
| 9/30/24 | Pending Next EPS Report |
| 6/30/24 | 14.40 |
| 3/31/24 | 18.41 |
| 9/30/24 | NA |
| 6/30/24 | NA |
| 3/31/24 | NA |
| 9/30/24 | Pending Next EPS Report |
| 6/30/24 | 1.06 |
| 3/31/24 | 0.87 |
| 9/30/24 | Pending Next EPS Report |
| 6/30/24 | 51.45 |
| 3/31/24 | 46.57 |

