We use cookies to understand how you use our site and to improve your experience.
This includes personalizing content and advertising.
By pressing "Accept All" or closing out of this banner, you consent to the use of all cookies and similar technologies and the sharing of information they collect with third parties.
You can reject marketing cookies by pressing "Deny Optional," but we still use essential, performance, and functional cookies.
In addition, whether you "Accept All," Deny Optional," click the X or otherwise continue to use the site, you accept our Privacy Policy and Terms of Service, revised from time to time.
You are being directed to ZacksTrade, a division of LBMZ Securities and licensed broker-dealer. ZacksTrade and Zacks.com are separate companies. The web link between the two companies is not a solicitation or offer to invest in a particular security or type of security. ZacksTrade does not endorse or adopt any particular investment strategy, any analyst opinion/rating/report or any approach to evaluating individual securities.
If you wish to go to ZacksTrade, click OK. If you do not, click Cancel.
Stocks priced under $10 can present appealing entry points for investors seeking outsized returns.
A depressed price can mask solid businesses facing temporary headwinds, such as cyclical downturns.
Investors must separate quality cheap stocks from value traps, where structural issues cap long-term upside.
Cheap stocks trading under $10 often attract investors looking to stretch their capital, uncover turnaround stories, or gain exposure to growing industries at a lower entry point. While a low share price alone doesn’t guarantee value, many sub-$10 stocks are established businesses temporarily out of favor, emerging growth companies, or overlooked operators with improving fundamentals.
Are Cheap Stocks a Good Investment?
Stocks priced under $10 can present appealing entry points for investors seeking asymmetric returns — the potential for outsized gains relative to the initial investment. Reputable analysts and financial outlets frequently flag these names because a depressed price can mask solid businesses facing temporary earnings pressure, cyclical slowdowns, or sentiment-driven selloffs.
That said, cheap does not always mean valuable. A low price may reflect:
Temporary earnings weakness or cyclical downturns.
Industry-wide headwinds.
Cash flow constraints.
Poor management execution.
Investors must separate quality cheap stocks from value traps, where structural issues cap long-term upside. As Warren Buffett has often emphasized, a stock is only a bargain if the underlying business can earn durable profits.
Below, we analyze and rank the best cheap stocks under $10 using a blend of Zacks Rank signals, Style Scores, and fundamentals.
This is our short term rating system that serves as a timeliness indicator for stocks over the next 1 to 3 months. How good is it? See rankings and related performance below.
The Zacks Industry Rank assigns a rating to each of the 265 X (Expanded) Industries based on their average Zacks Rank.
An industry with a larger percentage of Zacks Rank #1's and #2's will have a better average Zacks Rank than one with a larger percentage of Zacks Rank #4's and #5's.
The industry with the best average Zacks Rank would be considered the top industry (1 out of 265), which would place it in the top 1% of Zacks Ranked Industries. The industry with the worst average Zacks Rank (265 out of 265) would place in the bottom 1%.
The Zacks Sector Rank assigns a rating to each of the 16 Sectors based on their average Zacks Rank.
A sector with a larger percentage of Zacks Rank #1's and #2's will have a better average Zacks Rank than one with a larger percentage of Zacks Rank #4's and #5's.
The sector with the best average Zacks Rank would be considered the top sector (1 out of 16), which would place it in the top 1% of Zacks Ranked Sectors. The sector with the worst average Zacks Rank (16 out of 16) would place in the bottom 1%.
The Style Scores are a complementary set of indicators to use alongside the Zacks Rank. It allows the user to better focus on the stocks that are the best fit for his or her personal trading style.
The scores are based on the trading styles of Value, Growth, and Momentum. There's also a VGM Score ('V' for Value, 'G' for Growth and 'M' for Momentum), which combines the weighted average of the individual style scores into one score.
Value ScoreA
Growth ScoreA
Momentum ScoreA
VGM ScoreA
Within each Score, stocks are graded into five groups: A, B, C, D and F. As you might remember from your school days, an A, is better than a B; a B is better than a C; a C is better than a D; and a D is better than an F.
As an investor, you want to buy stocks with the highest probability of success. That means you want to buy stocks with a Zacks Rank #1 or #2, Strong Buy or Buy, which also has a Score of an A or a B in your personal trading style.
Zacks Earnings ESP (Expected Surprise Prediction) looks to find companies that have recently seen positive earnings estimate revision activity. The idea is that more recent information is, generally speaking, more accurate and can be a better predictor of the future, which can give investors an advantage in earnings season.
The technique has proven to be very useful for finding positive surprises. In fact, when combining a Zacks Rank #3 or better and a positive Earnings ESP, stocks produced a positive surprise 70% of the time, while they also saw 28.3% annual returns on average, according to our 10 year backtest.
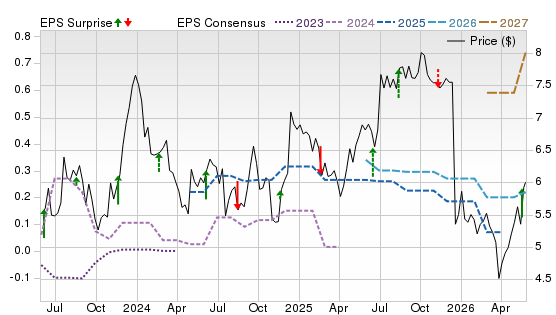
Digital Turbine operates a mobile advertising and app-discovery platform, with a market cap of $1.19 billion. In Q4 fiscal 2026, the company’s revenue rose 20% year over year, led by 57% growth in App Growth Platform, while its adjusted EBITDA climbed 53%. The shares remain inexpensive relative to that improving earnings base, and stronger carrier and advertiser execution could support further margin expansion.
Potential Risks
Advertising demand is cyclical, and concentration among carriers and device makers can amplify contract changes. Debt refinancing, platform competition, and privacy-policy shifts also could pressure cash flow.
Forecast
A Zacks Rank #1 (Strong Buy) indicates positive estimate revisions, while Scores of B for Value and Growth, and A for VGM are favorable overall. The Price, Consensus & EPS Surprise chart shows the price rebounding sharply, with 2026 estimates trending higher and recent earnings surprises skewing positive.
This is our short term rating system that serves as a timeliness indicator for stocks over the next 1 to 3 months. How good is it? See rankings and related performance below.
The Zacks Industry Rank assigns a rating to each of the 265 X (Expanded) Industries based on their average Zacks Rank.
An industry with a larger percentage of Zacks Rank #1's and #2's will have a better average Zacks Rank than one with a larger percentage of Zacks Rank #4's and #5's.
The industry with the best average Zacks Rank would be considered the top industry (1 out of 265), which would place it in the top 1% of Zacks Ranked Industries. The industry with the worst average Zacks Rank (265 out of 265) would place in the bottom 1%.
The Zacks Sector Rank assigns a rating to each of the 16 Sectors based on their average Zacks Rank.
A sector with a larger percentage of Zacks Rank #1's and #2's will have a better average Zacks Rank than one with a larger percentage of Zacks Rank #4's and #5's.
The sector with the best average Zacks Rank would be considered the top sector (1 out of 16), which would place it in the top 1% of Zacks Ranked Sectors. The sector with the worst average Zacks Rank (16 out of 16) would place in the bottom 1%.
The Style Scores are a complementary set of indicators to use alongside the Zacks Rank. It allows the user to better focus on the stocks that are the best fit for his or her personal trading style.
The scores are based on the trading styles of Value, Growth, and Momentum. There's also a VGM Score ('V' for Value, 'G' for Growth and 'M' for Momentum), which combines the weighted average of the individual style scores into one score.
Value ScoreA
Growth ScoreA
Momentum ScoreA
VGM ScoreA
Within each Score, stocks are graded into five groups: A, B, C, D and F. As you might remember from your school days, an A, is better than a B; a B is better than a C; a C is better than a D; and a D is better than an F.
As an investor, you want to buy stocks with the highest probability of success. That means you want to buy stocks with a Zacks Rank #1 or #2, Strong Buy or Buy, which also has a Score of an A or a B in your personal trading style.
Zacks Earnings ESP (Expected Surprise Prediction) looks to find companies that have recently seen positive earnings estimate revision activity. The idea is that more recent information is, generally speaking, more accurate and can be a better predictor of the future, which can give investors an advantage in earnings season.
The technique has proven to be very useful for finding positive surprises. In fact, when combining a Zacks Rank #3 or better and a positive Earnings ESP, stocks produced a positive surprise 70% of the time, while they also saw 28.3% annual returns on average, according to our 10 year backtest.
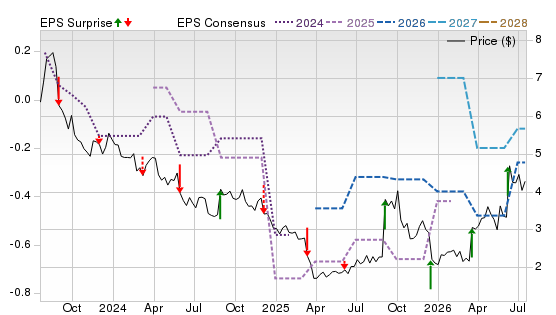
Inuvo provides AI-driven advertising technology and has a market cap of $18.38 million. The company’s IntentKey platform uses proprietary audience modeling to identify consumer intent without relying heavily on traditional identifiers, positioning the company to capitalize on advertisers’ growing demand for privacy-conscious targeting. The business also offers operating leverage as its technology can support additional advertising campaigns without equivalent cost growth.
Potential Risks
The company’s revenue remains small and volatile, and the legacy-search transition may depress near-term sales. IntentKey must win larger customers against better-funded rivals, while privacy changes and advertising cyclicality add uncertainty.
Forecast
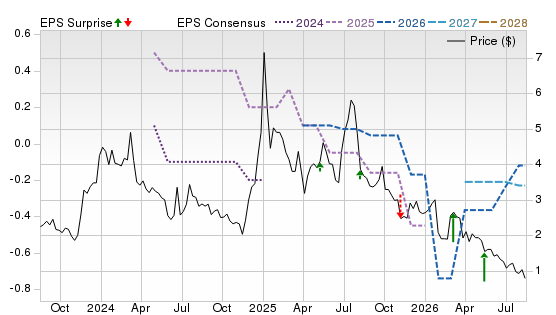
A Zacks Rank #1 with Scores of A for Growth and Momentum signals improving expectations and price action, even with a Value of D. The company’s chart shows a downward price trend, with volatile 2026 estimates, and mostly positive earnings surprises.
This is our short term rating system that serves as a timeliness indicator for stocks over the next 1 to 3 months. How good is it? See rankings and related performance below.
The Zacks Industry Rank assigns a rating to each of the 265 X (Expanded) Industries based on their average Zacks Rank.
An industry with a larger percentage of Zacks Rank #1's and #2's will have a better average Zacks Rank than one with a larger percentage of Zacks Rank #4's and #5's.
The industry with the best average Zacks Rank would be considered the top industry (1 out of 265), which would place it in the top 1% of Zacks Ranked Industries. The industry with the worst average Zacks Rank (265 out of 265) would place in the bottom 1%.
The Zacks Sector Rank assigns a rating to each of the 16 Sectors based on their average Zacks Rank.
A sector with a larger percentage of Zacks Rank #1's and #2's will have a better average Zacks Rank than one with a larger percentage of Zacks Rank #4's and #5's.
The sector with the best average Zacks Rank would be considered the top sector (1 out of 16), which would place it in the top 1% of Zacks Ranked Sectors. The sector with the worst average Zacks Rank (16 out of 16) would place in the bottom 1%.
The Style Scores are a complementary set of indicators to use alongside the Zacks Rank. It allows the user to better focus on the stocks that are the best fit for his or her personal trading style.
The scores are based on the trading styles of Value, Growth, and Momentum. There's also a VGM Score ('V' for Value, 'G' for Growth and 'M' for Momentum), which combines the weighted average of the individual style scores into one score.
Value ScoreA
Growth ScoreA
Momentum ScoreA
VGM ScoreA
Within each Score, stocks are graded into five groups: A, B, C, D and F. As you might remember from your school days, an A, is better than a B; a B is better than a C; a C is better than a D; and a D is better than an F.
As an investor, you want to buy stocks with the highest probability of success. That means you want to buy stocks with a Zacks Rank #1 or #2, Strong Buy or Buy, which also has a Score of an A or a B in your personal trading style.
Zacks Earnings ESP (Expected Surprise Prediction) looks to find companies that have recently seen positive earnings estimate revision activity. The idea is that more recent information is, generally speaking, more accurate and can be a better predictor of the future, which can give investors an advantage in earnings season.
The technique has proven to be very useful for finding positive surprises. In fact, when combining a Zacks Rank #3 or better and a positive Earnings ESP, stocks produced a positive surprise 70% of the time, while they also saw 28.3% annual returns on average, according to our 10 year backtest.
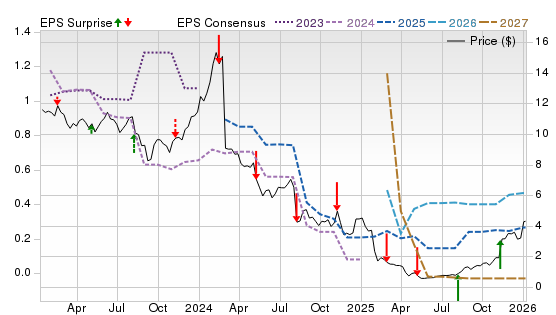
ReNew Energy develops utility-scale renewable power projects in India and has a market cap of $2.25 billion. Its large operating portfolio, expanding development pipeline and presence across wind, solar, storage, and hybrid projects provide multiple avenues for long-term growth. The company is positioned to benefit from India’s rising electricity demand and policy support for domestic renewable capacity.
Potential Risks
ReNew Energy remains capital intensive and exposed to interest costs, currency movements, counterparty payments and execution delays. Policy changes, grid constraints, weak renewable resources and equipment-price volatility could also reduce returns.
Forecast
A Zacks Rank #1 with a Score of B for Value points to favorable revisions, but Scores of D for Growth and VGM, and F for Momentum temper the signal. The company’s chart shows a volatile price trend, while estimates fall into 2026 before a sharp rebound in 2027, and earnings surprises are mixed.
This is our short term rating system that serves as a timeliness indicator for stocks over the next 1 to 3 months. How good is it? See rankings and related performance below.
The Zacks Industry Rank assigns a rating to each of the 265 X (Expanded) Industries based on their average Zacks Rank.
An industry with a larger percentage of Zacks Rank #1's and #2's will have a better average Zacks Rank than one with a larger percentage of Zacks Rank #4's and #5's.
The industry with the best average Zacks Rank would be considered the top industry (1 out of 265), which would place it in the top 1% of Zacks Ranked Industries. The industry with the worst average Zacks Rank (265 out of 265) would place in the bottom 1%.
The Zacks Sector Rank assigns a rating to each of the 16 Sectors based on their average Zacks Rank.
A sector with a larger percentage of Zacks Rank #1's and #2's will have a better average Zacks Rank than one with a larger percentage of Zacks Rank #4's and #5's.
The sector with the best average Zacks Rank would be considered the top sector (1 out of 16), which would place it in the top 1% of Zacks Ranked Sectors. The sector with the worst average Zacks Rank (16 out of 16) would place in the bottom 1%.
The Style Scores are a complementary set of indicators to use alongside the Zacks Rank. It allows the user to better focus on the stocks that are the best fit for his or her personal trading style.
The scores are based on the trading styles of Value, Growth, and Momentum. There's also a VGM Score ('V' for Value, 'G' for Growth and 'M' for Momentum), which combines the weighted average of the individual style scores into one score.
Value ScoreA
Growth ScoreA
Momentum ScoreA
VGM ScoreA
Within each Score, stocks are graded into five groups: A, B, C, D and F. As you might remember from your school days, an A, is better than a B; a B is better than a C; a C is better than a D; and a D is better than an F.
As an investor, you want to buy stocks with the highest probability of success. That means you want to buy stocks with a Zacks Rank #1 or #2, Strong Buy or Buy, which also has a Score of an A or a B in your personal trading style.
Zacks Earnings ESP (Expected Surprise Prediction) looks to find companies that have recently seen positive earnings estimate revision activity. The idea is that more recent information is, generally speaking, more accurate and can be a better predictor of the future, which can give investors an advantage in earnings season.
The technique has proven to be very useful for finding positive surprises. In fact, when combining a Zacks Rank #3 or better and a positive Earnings ESP, stocks produced a positive surprise 70% of the time, while they also saw 28.3% annual returns on average, according to our 10 year backtest.
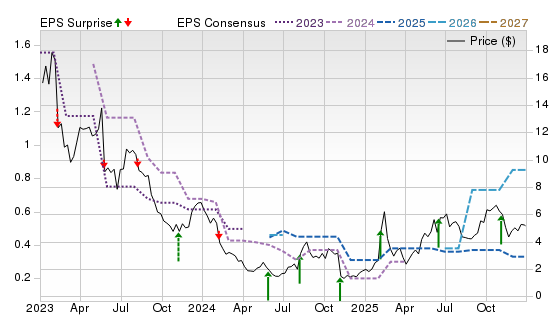
Duluth Holdings is a well-known provider of workwear, outdoor apparel, and accessories, with a market cap of $155.81 million. Management’s emphasis on tighter inventory control, more disciplined promotions, direct sourcing, and a greater mix of full-price sales could strengthen margins and cash generation over time. The company offers meaningful upside if the turnaround stabilizes sales and converts better merchandising discipline into sustained profitability.
Potential Risks
Lower promotions hurt web traffic and conversion, showing that margin gains may come at the expense of demand. Tariffs, sourcing costs, weak consumer spending, and execution risk around the “Build to Last” strategy could pressure results.
Forecast
A Zacks Rank #1 with Scores of A for Value and Growth signals strong revisions and turnaround potential, while the Momentum of D shows the market remains cautious. The chart shows a long price decline followed by stabilization, with 2026 estimates rebounding sharply. Recent surprises have improved, suggesting upside if sales stabilize and margins hold.
This is our short term rating system that serves as a timeliness indicator for stocks over the next 1 to 3 months. How good is it? See rankings and related performance below.
The Zacks Industry Rank assigns a rating to each of the 265 X (Expanded) Industries based on their average Zacks Rank.
An industry with a larger percentage of Zacks Rank #1's and #2's will have a better average Zacks Rank than one with a larger percentage of Zacks Rank #4's and #5's.
The industry with the best average Zacks Rank would be considered the top industry (1 out of 265), which would place it in the top 1% of Zacks Ranked Industries. The industry with the worst average Zacks Rank (265 out of 265) would place in the bottom 1%.
The Zacks Sector Rank assigns a rating to each of the 16 Sectors based on their average Zacks Rank.
A sector with a larger percentage of Zacks Rank #1's and #2's will have a better average Zacks Rank than one with a larger percentage of Zacks Rank #4's and #5's.
The sector with the best average Zacks Rank would be considered the top sector (1 out of 16), which would place it in the top 1% of Zacks Ranked Sectors. The sector with the worst average Zacks Rank (16 out of 16) would place in the bottom 1%.
The Style Scores are a complementary set of indicators to use alongside the Zacks Rank. It allows the user to better focus on the stocks that are the best fit for his or her personal trading style.
The scores are based on the trading styles of Value, Growth, and Momentum. There's also a VGM Score ('V' for Value, 'G' for Growth and 'M' for Momentum), which combines the weighted average of the individual style scores into one score.
Value ScoreA
Growth ScoreA
Momentum ScoreA
VGM ScoreA
Within each Score, stocks are graded into five groups: A, B, C, D and F. As you might remember from your school days, an A, is better than a B; a B is better than a C; a C is better than a D; and a D is better than an F.
As an investor, you want to buy stocks with the highest probability of success. That means you want to buy stocks with a Zacks Rank #1 or #2, Strong Buy or Buy, which also has a Score of an A or a B in your personal trading style.
Zacks Earnings ESP (Expected Surprise Prediction) looks to find companies that have recently seen positive earnings estimate revision activity. The idea is that more recent information is, generally speaking, more accurate and can be a better predictor of the future, which can give investors an advantage in earnings season.
The technique has proven to be very useful for finding positive surprises. In fact, when combining a Zacks Rank #3 or better and a positive Earnings ESP, stocks produced a positive surprise 70% of the time, while they also saw 28.3% annual returns on average, according to our 10 year backtest.
Ironwood Pharmaceuticals markets gastrointestinal therapies, led by LINZESS, and has a market cap of $648.97 million. The company’s appeal rests on LINZESS, an established prescription brand that generates recurring revenue and cash flow across multiple indications. Continued prescription growth, broader pediatric use and disciplined expense management could strengthen earnings and help reduce leverage.
Potential Risks
Ironwood Pharmaceuticals depends heavily on LINZESS and partner AbbVie, while Medicare pricing, rebate dynamics and patent expiry can erode economics. Apraglutide requires another Phase III trial, creating clinical, timing and spending risk, while debt remains meaningful.
Forecast
A Zacks Rank #1 with Scores of A for Value and VGM, and B for Momentum supports the setup, though a Growth of D flags limited pipeline visibility. The company’s chart shows price declining before a recent recovery, with 2026 estimates trending higher, and recent EPS surprises are mixed.
The Zacks Rank is a proprietary stock-rating model that uses trends in earnings estimate revisions and earnings-per-share (EPS) surprises to classify stocks into five groups: #1 (Strong Buy), #2 (Buy), #3 (Hold), #4 (Sell) and #5 (Strong Sell). The Zacks Rank is calculated through four primary factors related to earnings estimates: analysts' consensus on earnings estimate revisions, the magnitude of revision change, the upside potential and estimate surprise (or the degree in which earnings per share deviated from the previous quarter).
Zacks builds the data from 3,000 analysts at over 150 different brokerage firms. The average yearly gain for Zacks Rank #1 (Strong Buy) stocks is +23.94% per year from January, 1988, through June 1, 2026.
Selections for Best Cheap Stocks Under $10 are based on the current top ranking stocks based on Zacks Indicator Score, Style Scores and fundamentals. For this list, only companies that have average daily trading volumes of 100,000 shares or more were considered, as well as companies from the top 50% of all industries. All information is current as of market open, July 15, 2026.
General Questions About Cheap Stocks
What are the Benefits of Buying Cheap Stocks?
Cheap stocks can make investing more accessible, especially for investors who don’t want to commit large sums to a single position. Because these stocks trade at lower prices, investors can spread their capital across multiple companies, sectors, or strategies, helping improve diversification.
In addition, many stocks fall below $10 not because the underlying business is broken, but because of temporary challenges such as economic slowdowns, industry cycles, earnings volatility, or broader market sell-offs. When conditions improve, these stocks may rebound sharply, offering attractive upside potential. Cheap stocks can also provide exposure to undervalued or overlooked sectors that are out of favor but poised for recovery.
The primary risk with cheap stocks is that their low price may reflect genuine business problems rather than temporary setbacks. These companies often experience higher volatility, meaning prices can swing sharply in either direction. Many also have weaker balance sheets, higher debt loads, or limited cash reserves, making them more vulnerable during economic downturns.
Additionally, cheap stocks may face challenges raising capital, maintaining profitability, or competing with larger rivals. Without careful analysis, investors risk buying into so-called “value traps” — stocks that appear inexpensive but continue to decline because fundamentals fail to improve.
Can Cheap Stocks Actually Make Money?
Yes, cheap stocks can generate meaningful returns when purchased at the right time and for the right reasons. Numerous well-known companies have traded below $10 during periods of market stress, corporate restructuring, or industry downturns before eventually recovering.
That said, success is far from guaranteed. Cheap stocks tend to require patience, a willingness to tolerate volatility, and a focus on long-term business trends rather than short-term price movements.
Are Cheap Stocks a Good Investment for Beginners?
Cheap stocks can be suitable for beginners if approached cautiously. Their lower price points allow new investors to learn portfolio management, diversification, and risk control without committing excessive capital.
However, beginners should avoid concentrating too much money in a single cheap stock or chasing speculative names purely because they look inexpensive. Focusing on established companies, clear business models, and basic fundamentals can help reduce risk while building investing experience.
What is the Difference Between Cheap Stocks and Penny Stocks?
Cheap stocks generally trade under $10 but are listed on major exchanges like the NYSE or Nasdaq and are required to meet stricter regulatory and reporting standards. Penny stocks, by contrast, often trade under $5 — and frequently under $1 — and are commonly found on over-the-counter (OTC) markets.
Penny stocks typically carry far higher risk due to low liquidity, limited transparency, and greater susceptibility to manipulation. While some cheap stocks are speculative, they usually offer better disclosure and stability than penny stocks.
How to Select Fundamentally Strong Cheap Stocks
How can I Analyze a Cheap Stock's Potential?
Analyzing a cheap stock starts with examining its financial health and business model. Key areas to review include revenue growth trends, profitability or progress toward profitability, debt levels, and cash flow generation. Investors should also evaluate the company’s competitive position within its industry, the durability of its products or services, and management’s long-term strategy.
Beyond the numbers, it’s important to consider industry tailwinds, upcoming catalysts such as new products or restructuring efforts, and whether the company has a credible path to improving performance.
How do I Know if a Stock is Cheap or Just Bad?
A truly cheap stock trades at a low valuation relative to its future earnings potential, assets, or cash flow, often due to temporary challenges. These companies usually have a realistic plan for recovery, cost control, or growth.
A bad stock, on the other hand, lacks earnings visibility, suffers from persistent losses, carries excessive debt, or operates in a declining or obsolete industry. If management cannot articulate a clear strategy for improvement, or if fundamentals continue to deteriorate, the stock may remain cheap for the wrong reasons.
Strategy and Portfolio Building with Cheap Stocks
Is it Better to Buy 100 Shares of a Cheap Stock, or 1 Share of an Expensive Stock?
The number of shares owned is largely irrelevant. What matters is the percentage return on investment and the level of risk taken. A single share of a high-quality company can outperform hundreds of shares of a struggling business. Investors should focus on expected returns, downside risk, and how each position fits within the broader portfolio.
How do I Build a Diversified Portfolio Using Cheap Stocks?
Diversification with cheap stocks involves spreading investments across multiple sectors, industries, and business models. Combining growth-oriented names with income or value stocks can help balance risk and reward. Limiting position sizes — especially for more speculative companies — helps prevent any single stock from dominating portfolio performance.
How can I Screen for Cheap Stocks with Growth Potential?
Investors can use stock screeners to identify candidates by filtering for price, market capitalization, revenue growth, manageable debt levels, and improving margins. Additional filters such as analyst earnings revisions, insider buying, or strong free cash flow can further refine results. Screening helps narrow the field, but deeper research is still essential before investing.
Cheap Stock Investing Through ETFs
What are Some Good ETFs that Hold Cheap or Value Stocks?
Investors who prefer diversification over picking individual stocks may consider value-focused ETFs. Examples include:
Vanguard Value ETF (VTV).
iShares Russell 2000 Value ETF (IWN).
SPDR Portfolio S&P 600 Small Cap Value ETF (SLYV).
These funds hold baskets of undervalued stocks across multiple sectors and market capitalizations. ETFs can reduce single-stock risk while still providing exposure to companies trading at attractive valuations.




 View the Zacks #1 Rank List


 Strong Buy